Macro Equities
Market Crash Triggers
Bull, Bear, Bust · 31 May 2026 · 16 min read
MONTHLY RESEARCH · MARKET CRASH TRIGGERS
The Next Six Months
Bull, Bear, Bust · The Monthly Macro Memo · May 2026
After forty years watching this market, I have rarely seen a confluence of danger signals quite like the one gathering on our horizon today. This is not a prediction of doom. It is a sober assessment of the tripwires — any one of which could send this market into a serious decline over the next half year.
Let me walk you through what I am seeing, trigger by trigger. Some are already active. Others are gathering force. A few are speculative but worth watching closely.
KEY POINTS A quick-read snapshot of this newsletter's commentary
▸ Seven trigger families are lining up: a divided Fed in transition, the Iran war, recession signals, extreme valuations, AI / bubble froth, financial-system fragility, and a fragile technical setup. ▸ The Fed is trapped: Powell exits in May 2026, dissent in opposite directions is at a 35-year high, and there is no easy path between supporting jobs and fighting energy-driven inflation. ▸ The Iran war is already shock-wave one: Brent above $120, WTI from $67 to ~$100, energy CPI +12.5% YoY — a tax on every consumer and every business. ▸ Recession signals are flashing: February payrolls missed by 162k (−92k vs +70k expected), unemployment 4.4%, capex outside AI has collapsed from +24% to +3.9%, housing is frozen. ▸ Valuations are at historic extremes: Shiller CAPE 37.5 (avg 17.3, dot-com peak 44), market cap to GDP 252% (1929: 65%; 2000: 170%) — mean reversion implies −30 to −35%. ▸ Financial-system fragility is rising: private credit now 16% of institutional portfolios (vs 7% in 2008), the US is 'over-equitised', and a stock crash could become a bond / budget crisis. Jamie Dimon puts crash odds at 1-in-3. ▸ Technical breaking points are close: 100-day MA at 6,830 already broken, secondary support at 6,764 broken, the 200-day MA at 6,582 is the 'kiss of death' line. The S&P 500 sits there now. ▸ What we are doing: 40% cash, 50% highest-quality names only, 7% stop loss on every position, small S&P 500 put hedge (Dec 2026, strike 5,200), watch list of Japan / Korea net-nets ready. |
The Federal Reserve Problem
The Powell Exit in May 2026
Jerome Powell's term as Federal Reserve Chair ends in May 2026. That is weeks away. President Trump is expected to nominate a successor, likely Kevin Hassett, who favors aggressive rate cuts. Markets despise uncertainty, and a leadership transition at the world's most powerful central bank creates exactly that. No one knows how the new chair will react when the next crisis hits. That uncertainty alone can freeze institutional money.
A Divided Fed Cannot Guide the Market
The Federal Reserve's internal disagreements have reached historic levels. In December 2025, the Federal Open Market Committee saw dissenting votes in opposite directions. One member wanted a half-point rate cut. Another wanted no cut at all. This has happened only three times in thirty-five years. A divided Fed cannot give the market clear forward guidance. And without clear guidance, investors make fearful decisions.
The Fed Is Trapped
Here is the nightmare scenario playing out inside the Eccles Building in Washington. If the Fed cuts rates to support a weakening job market, it could reignite energy-driven inflation. If the Fed holds rates high to fight inflation, it could accelerate a recession. There is no easy path forward. A central bank with no good options is a central bank that creates volatility, not calm.
Stagflation Is Knocking
The Iran war has driven energy prices sharply higher. This revives the old 1970s nightmare called stagflation — higher inflation alongside slower economic growth. This creates a portfolio crisis because stocks and bonds fall together instead of offsetting each other. The traditional 60/40 portfolio stops working.
The Inverted Yield Curve Problem
Rising interest rates have inverted the yield curve. That means short-term bonds pay more than long-term bonds. Normally the opposite is true. This inversion places intense refinancing pressure on debtors, from corporations to homeowners. When debtors cannot refinance, defaults rise. When defaults rise, banks tighten lending. When banks tighten lending, the economy slows. It is a cascade.
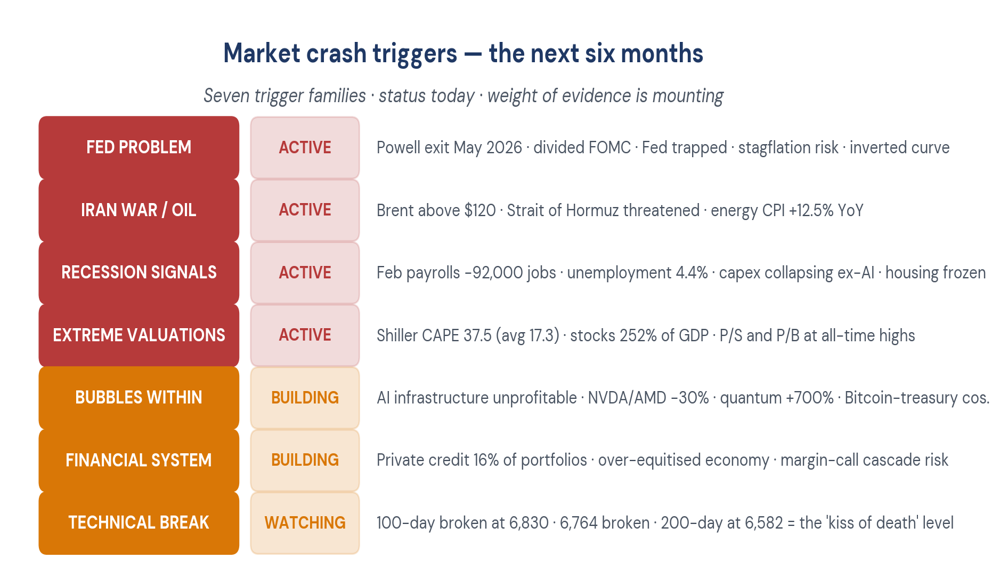 Figure 1. The seven trigger families — four already active, three building.
The Iran War and Its Shockwaves
The Conflict Is Already Here
American and Israeli forces launched airstrikes against Iran on February 28, 2026. The conflict has escalated since then. This is not a future possibility. It is current reality. And it threatens a functional shutdown of the Strait of Hormuz, the narrow waterway through which one-fifth of the world's oil supply flows each day.
Oil Prices Have Popped
Brent crude oil has exceeded $120 per barrel. West Texas Intermediate crude jumped from $67 to nearly $100 per barrel in a matter of weeks. Energy prices increased 12.5 percent year-over-year in March 2026, the largest such increase since the 2022 energy crisis. Higher energy costs act like a tax on every American consumer and every American business. That tax squeezes spending power while compressing corporate profit margins. Markets hate both.
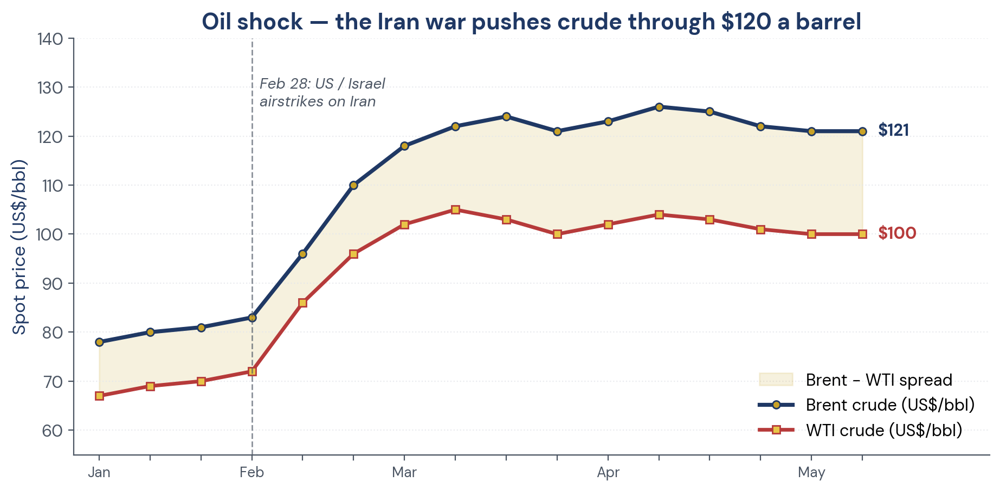 Figure 2. Oil shock — Brent and WTI surge after the Feb 28 airstrikes.
The Conflict Could Spread
If the Iran conflict persists through the summer, analysts worry it could spread regionally. A wider Middle East war would further disrupt global supply chains and energy markets. Every escalation brings new headlines, and new headlines bring new selling pressure.
The Recession Signals Are Flashing Red
The Jobs Numbers Are Alarming
The February 2026 payrolls report showed a loss of 92,000 jobs. Economists had expected a gain of 70,000. The miss was massive. The unemployment rate climbed to 4.4 percent. When job losses mount, consumer confidence crumbles. When consumer confidence crumbles, spending falls. When spending falls, corporate earnings fall. When earnings fall, stock prices fall.
The Consumer Is Running Out of Road
Consumer spending makes up roughly two-thirds of American economic growth. The warning signs are unmistakable. Real disposable income growth slowed to a 0.4 percent yearly pace in March, the lowest in three years. The personal savings rate dropped to 3.6 percent, the lowest since 2022. Real personal consumption expenditures grew only 2 percent in March. As one top economist put it, the consumer is on "very thin ice."
Businesses Have Stopped Spending
Outside of artificial intelligence, broader capital spending has collapsed dramatically. At the pandemic-era peak, capital expenditures grew over 24 percent. At the end of 2025, that growth rate had fallen to only 3.9 percent. The AI boom is hiding a broader private sector pullback. When businesses stop spending, they stop hiring. When they stop hiring, the recession deepens.
The Housing Market Is Frozen
Mortgage rates have climbed in recent weeks, significantly slowing buying activity. The housing market remains largely frozen as potential buyers wait for rates to fall. Sellers wait for prices to rise. Everyone is waiting. And waiting markets are fragile markets.
Top Economists See Recession Coming
Gary Shilling, a legendary economist whose track record spans five decades, says a recession is "almost inevitable" this year. He believes only a burst of fiscal stimulus or continued consumer strength could prevent it. He views both as unlikely. When a man of Shilling's experience speaks this clearly, wise investors listen.
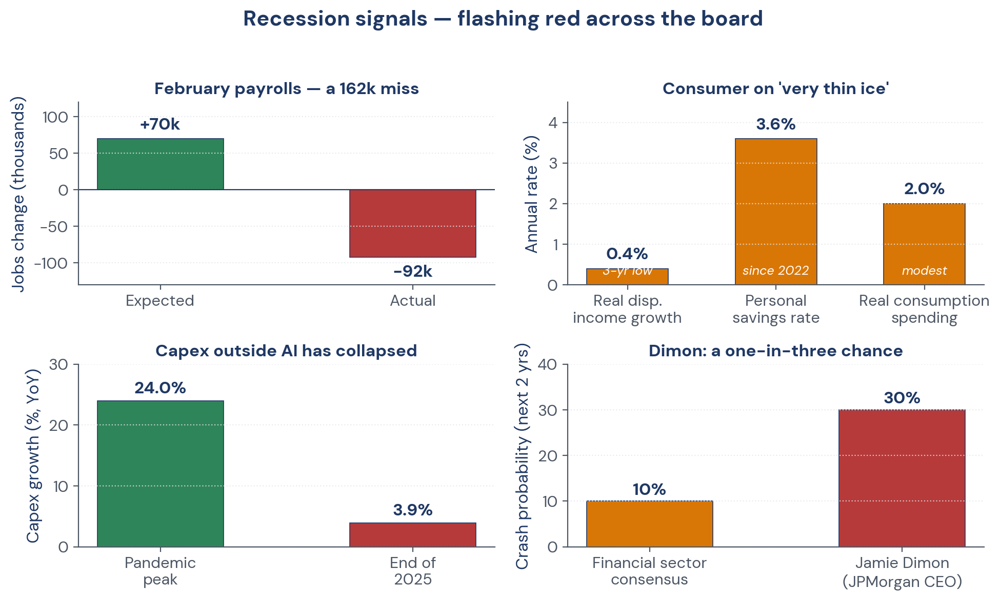 Figure 3. Recession signals dashboard — jobs, consumer, capex, crash probability.
Valuations That Defy Gravity
The Shiller CAPE Ratio Is Screaming Warning
The Shiller CAPE Ratio measures stock prices against average inflation-adjusted earnings over the past ten years. It is the best long-term valuation tool we have. Its current reading is approximately 37.5. The historical average since 1871 is 17.3. The only time the CAPE was higher was during the dot-com bubble, when it peaked around 44. We are closer to that peak than to sanity.
Here is what matters. In years when the S&P 500 suffered double-digit losses due to recession, the average Shiller P/E at the start of those years was only 21.3. At 37.5, the market is significantly more vulnerable than it has been before most historical crashes.
Stocks Are 252 Percent of GDP
Paul Tudor Jones, one of the great macro traders of our era, warns that the U.S. stock market cap currently stands at 252 percent of gross domestic product. In 1929, before the Great Depression crash, that figure was 65 percent. In 2000, before the dot-com crash, it was 170 percent. Simple mathematics suggests a 30 to 35 percent crash would return the ratio to its historical trend. Mean reversion is powerful. It is also painful.
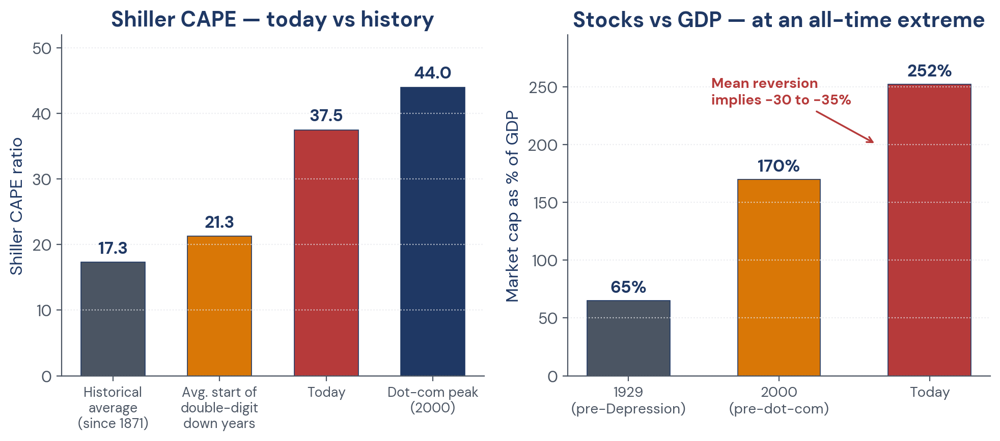 Figure 4. Two valuation gauges — Shiller CAPE and Market Cap / GDP, both at extremes.
Price-to-Sales and Price-to-Book at All-Time Highs
Both the price-to-sales ratio and the price-to-book ratio of the S&P 500 are at all-time highs. Investors are paying more for each dollar of sales and each dollar of book value than ever before in American history. That is not a sign of opportunity. It is a sign of excess.
Even the Fed Chair Is Worried
In September 2025, Federal Reserve Chair Jerome Powell stated plainly: "Equity prices are fairly highly valued." When the man in charge of monetary policy tells you stocks are expensive, paying attention is wise.
The Bubbles Within the Bubble
The AI Infrastructure Question
Artificial intelligence stocks have been the market's darlings. But key concerns are emerging. Most businesses have not optimized AI solutions or figured out how to generate positive return on investment. AI stocks are priced for straight-line growth, but history shows that next-big-thing technologies always have twists and turns. Nvidia and AMD have already seen their valuations slashed more than 30 percent from their peaks due to what analysts call "AI anxiety." A further leg down in AI stocks would drag the entire market with them.
The Quantum Computing Mania
Some pure-play quantum computing stocks rose approximately 700 percent over the trailing year. This happened with minimal sales to justify valuations north of $10 billion. When speculation detaches entirely from fundamentals, the eventual reckoning is usually violent.
The Bitcoin Treasury Companies
A new breed of company has emerged, holding large Bitcoin reserves on their balance sheets. Their stock prices rise and fall with cryptocurrency rather than with business fundamentals. Excessive speculation in these names could also burst, taking investor capital with it.
Financial System Fragilities
The Private Credit Crisis
Private credit, once a niche corner of finance, has exploded. The proportion of private equity in institutional portfolios increased from 7 percent during the 2007-2008 financial crisis to 16 percent currently. Valuations of exchange-listed business development corporations have fallen sharply. This makes the financial system "much more illiquid than in 2008," according to market observers. Illiquid systems crack, not bend.
The Over-Equitized Economy
Paul Tudor Jones describes the United States as "over-equitized" with the highest individual equity weightings in the country's history. Here is the hidden danger. If the market crashes, 10 percent of American tax revenues come from capital gains. Those revenues would fall to zero. This would cause a budget deficit blow-up and a hit to the bond market. A stock crash would become a bond crisis would become a government funding crisis.
The Margin Call Cascade
Liquidity constraints can trigger fire sales. As margin calls become more frequent, investors may be compelled to liquidate positions regardless of price. One forced sale triggers another, which triggers another. This is how a correction becomes a crash.
Jamie Dimon's Warning
JPMorgan Chase CEO Jamie Dimon estimates a 30 percent probability of a market crash within the next two years. That is significantly higher than the 10 percent forecasted by many in the financial sector. When the most experienced bank CEO in America gives you a one-in-three chance of a crash, preparing for that possibility is not paranoia. It is prudence.
The Technical Breaking Points
The 200-Day Moving Average at 6,582
The S&P 500's 200-day moving average sits at 6,582. This is not just a line on a chart. It is the level at which institutional money managers, pension funds, and algorithmic trading systems make decisions. A decisive close below this level on rising volume would likely trigger a wave of algorithmic selling. It would also mark the formal transition from a "healthy correction" to a "prolonged cyclical bear market." The level would flip from support to resistance — what traders call the "kiss of death." As of March 2026, the index was hovering near this critical line.
Failed Support Levels
The S&P 500 has already broken below its 100-day moving average at 6,830 and a secondary support level at 6,764. Each broken support level becomes future resistance. Each failure to hold makes the next failure more likely.
Thin Volume on Up Days
The recent market decline has been characterized by a slow-motion grind rather than a capitulation spike. Volume has been thin on up days, meaning institutional "smart money" is not buying the dips. Institutional money is moving to the sidelines. When the professionals stop buying, retail investors eventually notice.
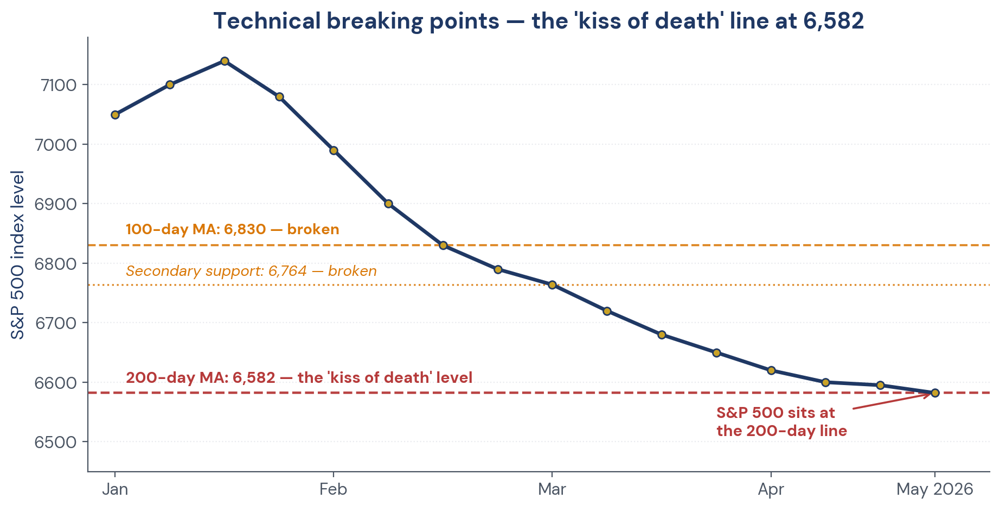 Figure 5. Technical breaking points — the S&P 500 sits on the 'kiss of death' line at 6,582.
Corporate Earnings Under Pressure
The Software Sector Has Cracked
Artificial intelligence appears to threaten the economics of software licenses and per-seat pricing. This has hit software stocks hard. The technology sector is now fragmented rather than rising together. When tech diverges, the market becomes fragile.
Transportation Is Collapsing
Delta Air Lines and United Airlines are struggling with the dual burden of skyrocketing jet fuel costs and cooling consumer demand for travel. The transportation sector is often a leading indicator. When trucks stop moving and planes stop flying, the broader economy follows.
Retail Faces a Double Squeeze
Amazon faces what one analyst called a "double whammy." The company faces increased logistics costs due to fuel prices while simultaneously serving a consumer base that is tightening its belt. Retail margins get squeezed from both sides.
The Magnificent Seven Concentration
When a handful of mega-cap technology stocks dominate market returns, their simultaneous decline can trigger an outsized index crash. We saw this in 2022. We could see it again. The market is not diversified when seven stocks drive all the returns.
Sentiment and Behaviour
Investors Are Still Too Optimistic
Despite recent declines, full capitulation has not occurred. You can see it in the lack of a panic spike in volatility. You can see it in the absence of overwhelming bearish sentiment readings. Investors are still holding out hope that support levels will hold. History teaches that markets bottom when hope dies. Hope is still very much alive.
The Stairs Down, Elevator Up Pattern
One market observer notes that the recent rebound followed only a 9.8 percent drop, not a deep bear market. He calls this pattern "stairs down and elevator up." Without a real washout, without real capitulation, without real fear, further downside remains. Healthy markets climb a wall of worry. Unhealthy markets slide down a slope of hope.
The Growing Wall Street-Main Street Divide
There is a growing divide between Wall Street and Main Street. Consumers are grappling with inflation and subdued sentiment while stocks have rallied on AI enthusiasm. When the economy and the stock market diverge, the stock market eventually follows the economy.
The 12.5 Percent Rally That Set Up a Crash
The S&P 500 experienced a historic 12.5 percent monthly rally, one of the biggest in seventy-six years. Sharp V-shaped rallies following incomplete corrections often exhaust themselves and reverse violently. What goes up fast can come down faster.
Trade and Fiscal Policy
The Tariff Fallout
The 10 percent global tariff and reciprocal tariffs introduced in April 2025 have increased costs for domestic manufacturers. A New York Federal Reserve study found that similar China tariffs in 2018 and 2019 negatively impacted productivity, employment, sales, and profits of affected American companies. Tariffs are taxes. Taxes slow economies.
Input Tariffs Fueling Inflation
Import tariffs on unfinished goods have increased domestic prices. These are not taxes on foreign finished products. They are taxes on American manufacturers who need foreign components. The cost increase passes directly to American consumers, contributing to higher inflation rates.
Fiscal Stimulus Is Unlikely
Gary Shilling notes that fiscal stimulus could prevent a downturn. He views it as unlikely given the current political environment. An election year with a divided Congress is not a recipe for bipartisan spending deals. The stimulus backstop may not be there when needed.
The Three Triggers Most Likely to Spark a Crash
Let me close with honest judgment. After forty years, I have learned to distinguish noise from signal. Here are the three signals most likely to matter in the next six months.
First: The Iran war and the oil shock
This trigger is already active. The Strait of Hormuz is functionally threatened. Oil is above $120. Every day the conflict continues, recession probability increases. This is not a future possibility. It is a present reality.
Second: The breach of the 200-day moving average at 6,582
Technical levels trigger real selling from real institutions with real money. The index is hovering at this line as I write. A decisive close below on heavy volume would flip market sentiment from "buy the dip" to "sell the rally." Once that line is broken, the algorithms take over.
Third: Recession confirmation through jobs and spending data
The February jobs report already showed losses of 92,000 jobs. If the March and April data confirm further deterioration, the "soft landing" narrative that has supported this market will collapse. A soft landing cannot survive job losses and spending pullbacks.
What We Are Doing
Let me tell you directly what we are doing with our own portfolios at BBB.
We have raised cash to forty percent of total assets. This is not market timing. It is sleeping well at night. When thirty crash triggers are lined up like freight cars on a track, holding dry powder is not pessimism. It is prudence.
We have tightened every stop loss to seven percent on remaining equity positions. No exceptions. No stories. No "this time is different." A seven percent loss is a scratch. A twenty percent loss is a wound. A fifty percent loss is a career-ender. We choose scratches.
We are holding the fifty percent of our portfolio that remains invested in the highest quality names only. Balance sheets with no debt. Dividends paid without interruption for twenty-five years. Businesses people need in good times and bad. We are not reaching for yield. We are not speculating on quantum computing or Bitcoin treasuries. We are owning businesses that would survive a depression, let alone a recession.
We have added a small position in long-dated put options on the S&P 500, specifically the December 2026 contracts with a strike price of 5,200. This is not a large bet. It is insurance. The premium is the price of sleep. If the market crashes, these puts will offset losses in our equity portfolio. If the market rallies, we lose the premium and move on. Insurance costs money. Not having insurance costs more.
Finally, we are building a watch list of net-net stocks in Japan and Sth Korea. When the crash comes, and if history is any guide it will come eventually, we intend to be buyers of assets trading at half of net working capital. Graham taught us that the time to buy is when there is blood in the streets. We are preparing our shopping list now.
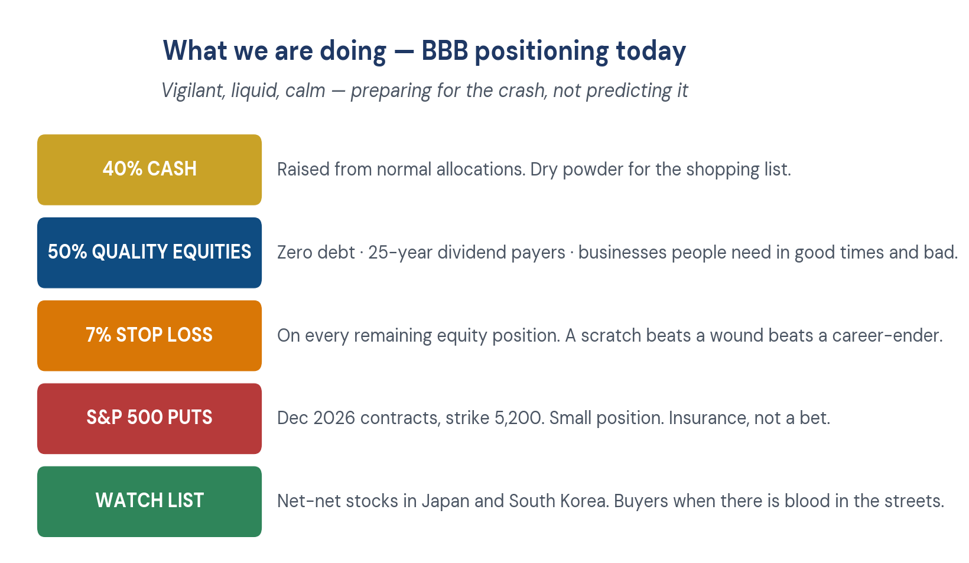 Figure 6. BBB current positioning — vigilant, liquid, calm.
We are not predicting the crash. We are preparing for it. There is a difference.
You will hear from me immediately when any one of the three triggers trips. Until then, we remain vigilant, liquid, and calm.
DISCLAIMER This newsletter is published for informational and educational purposes only. Nothing contained herein constitutes investment advice, a solicitation, or a recommendation to buy or sell any financial instrument. All investment involves risk, including the loss of principal. Past commentary does not guarantee future results. Any views expressed are those of the author as of the date of publication and are subject to change without notice. Please consult a licensed financial advisor before making any investment decisions. |