Macro Analysis China
MONTHLY RESEARCH · CHINESE EQUITIES The Long March Back Risk Assessment & Market Roadmap: Chinese Equities Bull, Bear, Bust · The Monthly Macro Memo · May 2026 We have spent considerable time in recent reports discussing the risks and opportunities in Western markets — the United States, Europe, and Japan. But we would be remiss if we did not turn our attention to the world's second-largest equity market. China is different. It is not just another emerging market. It is a complex, policy-driven, often misunderstood behemoth that deserves its own dedicated analysis. In this report, we apply the same rigorous, evidence-based framework we use for global markets to the Chinese equity universe. We will examine the monetary, economic, valuation, and technical indicators that drive our view. We will assess the current weight of evidence. And we will provide a month-by-month roadmap for the next 12 months. This report is educational. It is transparent. It explains what we are doing and why. Let us begin.
KEY POINTS A quick-read snapshot of this newsletter's commentary We apply the same MEVT framework to China that we use globally. Three of four pillars lean positive; the weight of evidence is moderately bullish, but selectively. Monetary backdrop is supportive: M2 growing 8.5%, M2-M1 gap narrowest in three years; the People's Bank of China remains accommodative. Economic data is two-speed: manufacturing PMI 50.3 with new export orders back in expansion for the first time since April 2024; services and construction soft at 49.4. Valuations are attractive vs. the US (Buffett Indicator 73-94% vs. ~200%), but selective within China: agriculture, food & beverage, non-bank financials are cheap; STAR 50 and real estate at the 98th percentile. Technicals are constructive: the CSI 300 sits above its 50- and 200-day moving averages with 12 buy signals and zero sell signals across our trend models. Our 12-month roadmap targets the CSI 300 at 5,200 by March 2027, via six phases: consolidation, contagion, decoupling rally, resistance, policy push, and reality check. Current positioning: ~5% China overweight; long energy security / NEV, healthcare, food & beverage; underweight real estate and overvalued tech; 15-20% cash within the China sleeve. We are positioning for a moderate overweight based on the weight of evidence, with clear triggers to add or reduce as conditions change. |
Part One: The Chinese Exception — Why China Requires Its Own Framework
Before we dive into the indicators, we need to acknowledge something important. China does not always behave like other markets.
In most developed markets, monetary policy is relatively predictable, corporate governance is standardised, and investor sentiment drives short-term moves. China adds three additional layers of complexity.
First, policy drives everything. The Chinese Communist Party and its various agencies — the People's Bank of China, the National Development and Reform Commission, the China Securities Regulatory Commission — have a level of direct control over markets that has no parallel in the West. When Beijing wants markets to rise, they have tools to make it happen. When they want to cool speculation, they act swiftly.
Second, the structure of the market is unique. China has two classes of shares — A-shares (traded in Shanghai and Shenzhen, predominantly for domestic investors) and H-shares (traded in Hong Kong, accessible to global investors). MSCI China and CSI 300 indices give us a blended view, but the liquidity and volatility characteristics differ significantly between the two.
Third, sentiment in China is heavily influenced by domestic retail investors, who account for a much larger share of trading volume than in developed markets. This can lead to exaggerated moves and rapid sentiment shifts.
Our approach acknowledges these complexities. We do not simply import our global models and apply them to China. We adapt. We use China-specific indicators. And we maintain a healthy respect for the policy wildcard.
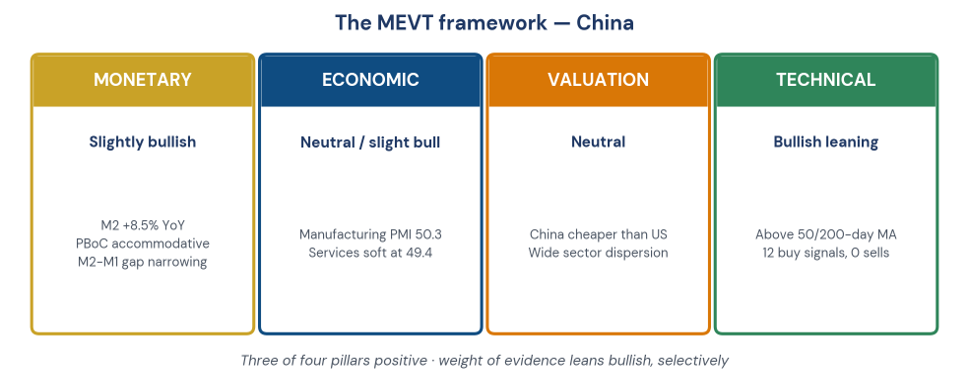 Figure 1. The MEVT framework applied to China — three of four pillars currently positive.
Part Two: Monetary Indicators — The Liquidity Tap in Beijing
Monetary conditions in China are arguably more important than anywhere else. When the People's Bank of China eases, liquidity flows into the system, banks lend, and markets tend to rise. When they tighten, the reverse happens.
Here is what our monetary dashboard is showing.
M2 Money Supply Growth
M2 is the broadest measure of money supply in China, including currency, demand deposits, and time deposits. It is a proxy for overall liquidity in the economy.
As of March 2026, M2 stood at approximately 353.9 trillion yuan, growing at an annual rate of 8.5 percent. This is down from the double-digit growth rates seen during the pandemic stimulus years but remains solidly positive.
More importantly, the M2 growth rate has stabilised after a period of deceleration. The People's Bank of China is not flooding the system with liquidity, but neither are they draining it. The tap is open but not gushing.
M1 Money Supply Growth and the M2-M1 Gap
M1 is a narrower measure — currency plus demand deposits. It represents money available for immediate spending and is a reasonable proxy for corporate transaction activity and business confidence.
As of March 2026, M1 grew at 5.1 percent year on year. The gap between M2 (8.5 percent) and M1 (5.1 percent) has now remained below 5 percentage points for 10 consecutive months — the narrowest gap in three years.
This is significant. A narrowing M2-M1 gap suggests that the money sitting in longer-term deposits is shifting into transaction accounts. Businesses are preparing to spend. Investment intentions may be firming.
Figure 1. The MEVT framework applied to China — three of four pillars currently positive.
Part Two: Monetary Indicators — The Liquidity Tap in Beijing
Monetary conditions in China are arguably more important than anywhere else. When the People's Bank of China eases, liquidity flows into the system, banks lend, and markets tend to rise. When they tighten, the reverse happens.
Here is what our monetary dashboard is showing.
M2 Money Supply Growth
M2 is the broadest measure of money supply in China, including currency, demand deposits, and time deposits. It is a proxy for overall liquidity in the economy.
As of March 2026, M2 stood at approximately 353.9 trillion yuan, growing at an annual rate of 8.5 percent. This is down from the double-digit growth rates seen during the pandemic stimulus years but remains solidly positive.
More importantly, the M2 growth rate has stabilised after a period of deceleration. The People's Bank of China is not flooding the system with liquidity, but neither are they draining it. The tap is open but not gushing.
M1 Money Supply Growth and the M2-M1 Gap
M1 is a narrower measure — currency plus demand deposits. It represents money available for immediate spending and is a reasonable proxy for corporate transaction activity and business confidence.
As of March 2026, M1 grew at 5.1 percent year on year. The gap between M2 (8.5 percent) and M1 (5.1 percent) has now remained below 5 percentage points for 10 consecutive months — the narrowest gap in three years.
This is significant. A narrowing M2-M1 gap suggests that the money sitting in longer-term deposits is shifting into transaction accounts. Businesses are preparing to spend. Investment intentions may be firming.
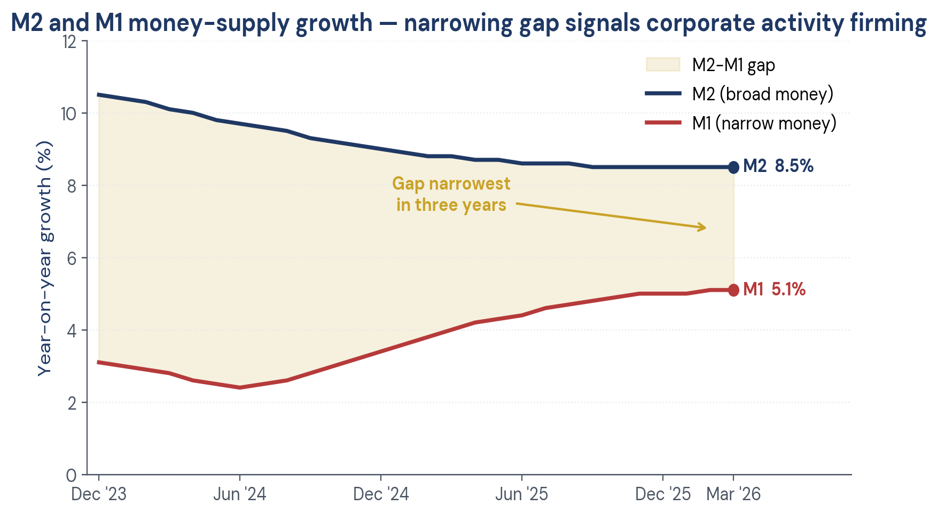 Figure 2. M2 and M1 growth rates — the gap is the narrowest in three years.
Monetary Policy Stance
The People's Bank of China has maintained a "moderately loose" monetary policy stance throughout late 2025 and into 2026. Reserve requirement ratios have been reduced. Policy rates have been trimmed. The regulatory crackdowns that weighed on technology and property sectors in 2021 through 2023 have largely run their course.
From a monetary perspective, the backdrop for Chinese equities is moderately supportive. Not euphoric. Not tight. Supportive.
Part Three: Economic Indicators — The Real Economy Beneath the Headlines
Monetary conditions tell us about the fuel. Economic indicators tell us whether the engine is firing. China's economic data has shown a mixed but improving picture.
Manufacturing PMI — The Bright Spot
The official manufacturing Purchasing Managers' Index for April 2026 came in at 50.3. This is slightly down from March's 50.4 but remains above the critical 50-level that separates expansion from contraction. This marks the second consecutive month of manufacturing expansion.
Drilling into the sub-indices reveals genuine strength.
The production index rose to 51.5, up from 51.4, indicating that factories are increasing output. More importantly, the new export orders index jumped to 50.3 — the first time it has been in expansion territory since April 2024. This suggests that global demand for Chinese manufactured goods is stabilising, despite the geopolitical headwinds.
Small and medium-sized enterprises, which are more representative of the private sector, showed particular strength. The PMI for medium-sized enterprises rose to 50.5, and for small enterprises to 50.1 — both moving back into expansion territory.
Figure 2. M2 and M1 growth rates — the gap is the narrowest in three years.
Monetary Policy Stance
The People's Bank of China has maintained a "moderately loose" monetary policy stance throughout late 2025 and into 2026. Reserve requirement ratios have been reduced. Policy rates have been trimmed. The regulatory crackdowns that weighed on technology and property sectors in 2021 through 2023 have largely run their course.
From a monetary perspective, the backdrop for Chinese equities is moderately supportive. Not euphoric. Not tight. Supportive.
Part Three: Economic Indicators — The Real Economy Beneath the Headlines
Monetary conditions tell us about the fuel. Economic indicators tell us whether the engine is firing. China's economic data has shown a mixed but improving picture.
Manufacturing PMI — The Bright Spot
The official manufacturing Purchasing Managers' Index for April 2026 came in at 50.3. This is slightly down from March's 50.4 but remains above the critical 50-level that separates expansion from contraction. This marks the second consecutive month of manufacturing expansion.
Drilling into the sub-indices reveals genuine strength.
The production index rose to 51.5, up from 51.4, indicating that factories are increasing output. More importantly, the new export orders index jumped to 50.3 — the first time it has been in expansion territory since April 2024. This suggests that global demand for Chinese manufactured goods is stabilising, despite the geopolitical headwinds.
Small and medium-sized enterprises, which are more representative of the private sector, showed particular strength. The PMI for medium-sized enterprises rose to 50.5, and for small enterprises to 50.1 — both moving back into expansion territory.
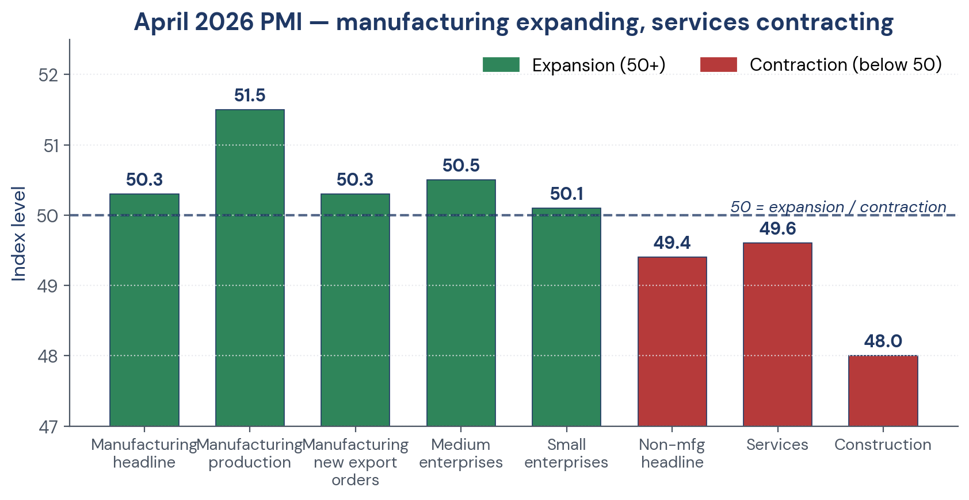 Figure 3. April 2026 PMI sub-indices — manufacturing expanding, services contracting.
Non-Manufacturing PMI — The Soft Spot
Not all the news is good. The non-manufacturing PMI (covering services and construction) fell to 49.4 in April, down from 50.1 and below the critical 50-level. The construction sub-index fell to 48, and services fell to 49.6.
This divergence is critical. Manufacturing is recovering. Services are softening. The consumer-facing parts of the economy — retail, hospitality, real estate services — remain under pressure. This is consistent with a "two-speed" recovery where export-oriented industry leads and domestic consumption lags.
Inflation — The Policy Constraint
Producer price inflation is picking up due to higher energy costs from the Middle East conflict. Nomura expects April PPI to rise to 1.3 percent year on year, up from 0.5 percent in March. This is not yet problematic, but it bears watching. If energy prices continue to rise, the People's Bank of China may have less room to ease further.
Summary of Economic Indicators
The Chinese economy is healing, but the recovery is uneven. Manufacturing — particularly high-tech manufacturing and exports — is doing well. Services and consumption are lagging. The policy response has been measured, not panicked. We are not seeing the rapid acceleration that would fuel a runaway bull market, but we are also not seeing the deterioration that would signal a new crisis.
Part Four: Valuation Indicators — How Expensive Is China?
This is where the Chinese market becomes interesting relative to its global peers.
The Buffett Indicator — China Version
For the United States, the Buffett Indicator (total market cap to GDP) stands at nearly 200 percent — a level that has historically preceded poor long-term returns. For China, the picture is very different.
The current A-share Buffett Indicator stands at approximately 73 to 94 percent, depending on the exact measure used. This is above "safe zone" levels but nowhere near the extremes seen in the United States. More importantly, it is roughly in line with historical averages.
Figure 3. April 2026 PMI sub-indices — manufacturing expanding, services contracting.
Non-Manufacturing PMI — The Soft Spot
Not all the news is good. The non-manufacturing PMI (covering services and construction) fell to 49.4 in April, down from 50.1 and below the critical 50-level. The construction sub-index fell to 48, and services fell to 49.6.
This divergence is critical. Manufacturing is recovering. Services are softening. The consumer-facing parts of the economy — retail, hospitality, real estate services — remain under pressure. This is consistent with a "two-speed" recovery where export-oriented industry leads and domestic consumption lags.
Inflation — The Policy Constraint
Producer price inflation is picking up due to higher energy costs from the Middle East conflict. Nomura expects April PPI to rise to 1.3 percent year on year, up from 0.5 percent in March. This is not yet problematic, but it bears watching. If energy prices continue to rise, the People's Bank of China may have less room to ease further.
Summary of Economic Indicators
The Chinese economy is healing, but the recovery is uneven. Manufacturing — particularly high-tech manufacturing and exports — is doing well. Services and consumption are lagging. The policy response has been measured, not panicked. We are not seeing the rapid acceleration that would fuel a runaway bull market, but we are also not seeing the deterioration that would signal a new crisis.
Part Four: Valuation Indicators — How Expensive Is China?
This is where the Chinese market becomes interesting relative to its global peers.
The Buffett Indicator — China Version
For the United States, the Buffett Indicator (total market cap to GDP) stands at nearly 200 percent — a level that has historically preceded poor long-term returns. For China, the picture is very different.
The current A-share Buffett Indicator stands at approximately 73 to 94 percent, depending on the exact measure used. This is above "safe zone" levels but nowhere near the extremes seen in the United States. More importantly, it is roughly in line with historical averages.
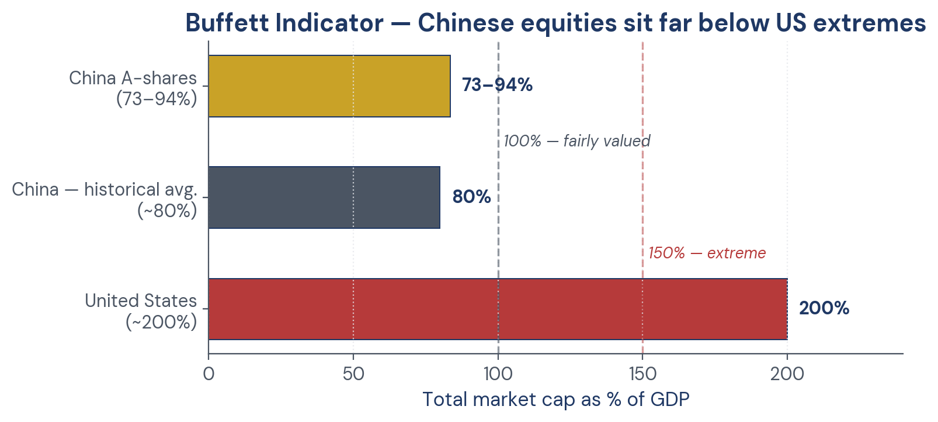 Figure 4. Buffett Indicator — China sits near its historical average; the US is more than double.
Chinese equities are not cheap relative to their own history in some indices — the CSI 300 PE valuation is at the 83rd percentile of its historical range, and the STAR 50 (China's tech-heavy growth board) is at the 98th percentile. But relative to US valuations, China is substantially cheaper on every metric.
Sector Valuation Dispersion — Where the Opportunities and Risks Lie
The dispersion across sectors is extreme and informative.
Attractive sectors (low valuation percentiles — below 20th percentile historically):
Food and beverage — historically cheap. Non-bank financials — cheap. Agriculture — very cheap, with PE below the 7th percentile historically. These are defensive, consumer-oriented sectors that have been left behind in the rally.
Expensive sectors (high valuation percentiles — above 80th percentile historically):
Steel, media, automotive, telecommunications, electronics, computing, real estate, and retail all trade at elevated multiples relative to their own histories. Real estate, in particular, is at the 98th percentile despite the ongoing property crisis — a puzzling divergence that bears close watching.
Figure 4. Buffett Indicator — China sits near its historical average; the US is more than double.
Chinese equities are not cheap relative to their own history in some indices — the CSI 300 PE valuation is at the 83rd percentile of its historical range, and the STAR 50 (China's tech-heavy growth board) is at the 98th percentile. But relative to US valuations, China is substantially cheaper on every metric.
Sector Valuation Dispersion — Where the Opportunities and Risks Lie
The dispersion across sectors is extreme and informative.
Attractive sectors (low valuation percentiles — below 20th percentile historically):
Food and beverage — historically cheap. Non-bank financials — cheap. Agriculture — very cheap, with PE below the 7th percentile historically. These are defensive, consumer-oriented sectors that have been left behind in the rally.
Expensive sectors (high valuation percentiles — above 80th percentile historically):
Steel, media, automotive, telecommunications, electronics, computing, real estate, and retail all trade at elevated multiples relative to their own histories. Real estate, in particular, is at the 98th percentile despite the ongoing property crisis — a puzzling divergence that bears close watching.
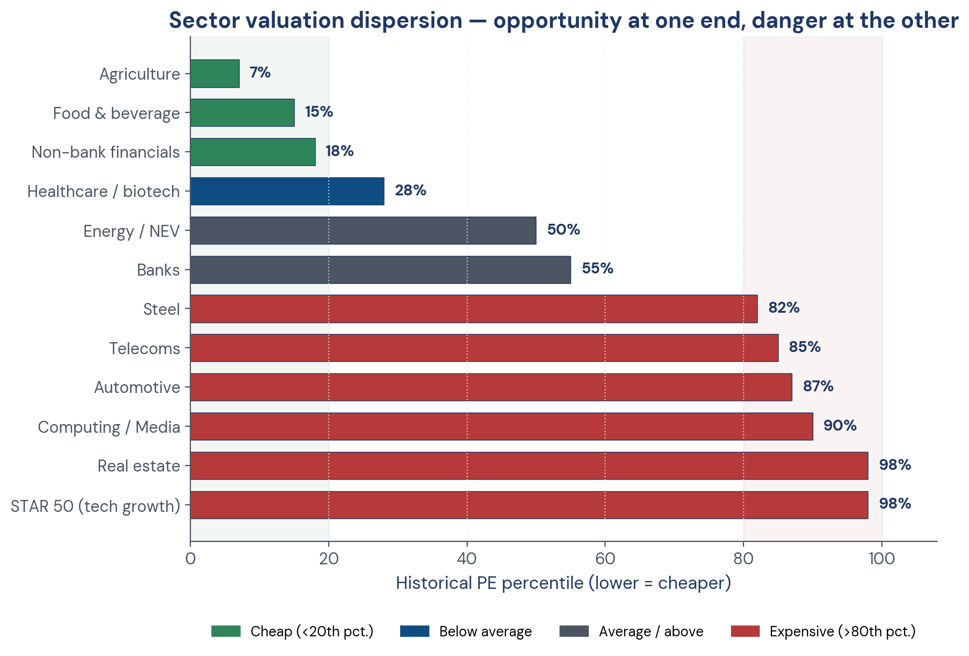 Figure 5. Sector valuation dispersion — opportunity at one end, danger at the other.
Summary of Valuation Indicators
Chinese equities are not universally cheap. The technology-heavy STAR 50 and the broad CSI 300 are trading at relatively high historical valuations. But the overall market is far less expensive than the United States. And within China, there are pockets of genuine value — food and beverage, agriculture, non-bank financials — that trade near their cheapest levels in a decade.
This is not a "buy everything" signal. But it is a "selective value opportunity" signal.
Part Five: Technical Indicators — What Is the Chinese Market Actually Doing?
Valuations tell us where the market should be. Technicals tell us where it is going. Here is what the charts are showing.
CSI 300 Technical Picture
As of mid-April 2026, the CSI 300 index is trading above all key moving averages. The 50-day moving average stands at approximately 4647, and the 200-day moving average stands at approximately 4596. The index is above both.
More importantly, our moving average summary currently shows 12 buy signals and zero sell signals across simple and exponential moving averages for periods ranging from 5 to 200 days. This is a "strong buy" signal from a purely trend-following perspective.
Breadth and Participation
We do not have comprehensive breadth data for the full Chinese universe in this report, but anecdotal evidence from fund flows and sector performance suggests that participation has been improving. Small and medium-sized enterprise PMI data shows improving conditions, which should translate into broader market participation over time.
Relative Strength vs. Global Markets
Chinese equities have underperformed US equities significantly over the past three years. That underperformance has created a valuation gap. The question is whether that gap will close through Chinese outperformance or US underperformance. Our view leans toward the latter — a weaker US dollar and a rotation away from expensive US growth stocks could benefit China.
Summary of Technical Indicators
The technical picture for Chinese equities is constructive but not euphoric. The CSI 300 is in an uptrend, above its key moving averages. The trend-following signals are positive. But we are not seeing the kind of parabolic move that precedes a major top. This is a steady, grind-higher technical setup — not a blow-off top.
Part Six: The Policy Wildcard — What Beijing Is Thinking
No analysis of Chinese markets is complete without addressing the policy environment.
The End of the Crackdown
The regulatory crackdowns on technology, property, and private education that began in 2021 have largely concluded. The message from Beijing has shifted from "rectification" to "support." This matters. The overhang of regulatory uncertainty that depressed valuations for years is lifting.
Property Sector Stabilisation
The property sector remains a concern. Real estate valuations are puzzlingly high given the ongoing stress — the PE for real estate is at the 98th percentile historically. That suggests either a speculative bubble or a misreading of the data. We are cautious on property.
However, the worst of the property crisis appears to be behind us. Defaults have been contained. The government has backstopped the most systemically important developers. The sector is not fixed, but it is no longer falling apart.
Central Government Funding as a Backstop
JP Morgan notes that "central government-backed funding serves as a critical backstop" for Chinese equities. This is a distinctly Chinese feature. When private demand falters, state-owned enterprises and government-funded infrastructure projects can fill the gap. This puts a floor under the market that does not exist in other countries.
Part Seven: Putting It All Together — The Weight of Evidence for China
Let us score China across our four pillars, just as we do for global markets.
Monetary indicators: Moderately supportive. M2 is growing at 8.5 percent. The M2-M1 gap is narrowing. The People's Bank of China remains accommodative. Verdict: Slightly bullish.
Economic indicators: Mixed but improving. Manufacturing is expanding. Exports are recovering. Services are soft but not collapsing. Verdict: Neutral to slightly bullish.
Valuation indicators: Attractive relative to the US, less attractive relative to China's own history in some indices. Significant dispersion across sectors creates selective opportunities. Verdict: Neutral (bullish on specific sectors, cautious on expensive tech).
Technical indicators: Constructive. The CSI 300 is above its key moving averages. Trend signals are positive. Breadth is improving. Verdict: Bullish leaning.
Weight of evidence: The balance leans positive, but with important caveats. This is not a "go all in" signal. It is a "selectively add exposure, favour value sectors over expensive tech, and respect the policy environment" signal.
Part Eight: JP Morgan's View — A Useful Benchmark
We do not simply adopt other firms' views, but we pay attention when a major global bank publishes a detailed China outlook.
JP Morgan recently reiterated its base-case end-2026 targets of 100 points for the MSCI China Index (implying 30 percent upside) and 5200 points for the CSI 300 Index (implying 17 percent upside). Under a bear case, they see 80 points and 4000 points, respectively.
Their favoured themes are instructive. They like energy security — including new energy vehicles, energy storage systems, power equipment, and aluminium. They like artificial intelligence and robotics. They are selective on consumption, focusing on younger generation demand for physical and mental health products. They are cautious on export-oriented stocks not related to these themes, citing global stagflation risks and US tariff investigations.
Their top picks include BYD Company (new energy vehicles), NAURA (semiconductor equipment), Bank of China (financials), Innovent Bio (healthcare), and CNOOC (energy).
We share much of this framework. The themes align with our global views. The caution on exports is consistent with our bearish roadmap for Western markets.
Part Nine: The 12-Month Market Roadmap for Chinese Equities — Month by Month
Given the weight of evidence described above, here is our probabilistic roadmap for Chinese equities over the next 12 months. We are presenting this as a guide, not a prediction.
Figure 5. Sector valuation dispersion — opportunity at one end, danger at the other.
Summary of Valuation Indicators
Chinese equities are not universally cheap. The technology-heavy STAR 50 and the broad CSI 300 are trading at relatively high historical valuations. But the overall market is far less expensive than the United States. And within China, there are pockets of genuine value — food and beverage, agriculture, non-bank financials — that trade near their cheapest levels in a decade.
This is not a "buy everything" signal. But it is a "selective value opportunity" signal.
Part Five: Technical Indicators — What Is the Chinese Market Actually Doing?
Valuations tell us where the market should be. Technicals tell us where it is going. Here is what the charts are showing.
CSI 300 Technical Picture
As of mid-April 2026, the CSI 300 index is trading above all key moving averages. The 50-day moving average stands at approximately 4647, and the 200-day moving average stands at approximately 4596. The index is above both.
More importantly, our moving average summary currently shows 12 buy signals and zero sell signals across simple and exponential moving averages for periods ranging from 5 to 200 days. This is a "strong buy" signal from a purely trend-following perspective.
Breadth and Participation
We do not have comprehensive breadth data for the full Chinese universe in this report, but anecdotal evidence from fund flows and sector performance suggests that participation has been improving. Small and medium-sized enterprise PMI data shows improving conditions, which should translate into broader market participation over time.
Relative Strength vs. Global Markets
Chinese equities have underperformed US equities significantly over the past three years. That underperformance has created a valuation gap. The question is whether that gap will close through Chinese outperformance or US underperformance. Our view leans toward the latter — a weaker US dollar and a rotation away from expensive US growth stocks could benefit China.
Summary of Technical Indicators
The technical picture for Chinese equities is constructive but not euphoric. The CSI 300 is in an uptrend, above its key moving averages. The trend-following signals are positive. But we are not seeing the kind of parabolic move that precedes a major top. This is a steady, grind-higher technical setup — not a blow-off top.
Part Six: The Policy Wildcard — What Beijing Is Thinking
No analysis of Chinese markets is complete without addressing the policy environment.
The End of the Crackdown
The regulatory crackdowns on technology, property, and private education that began in 2021 have largely concluded. The message from Beijing has shifted from "rectification" to "support." This matters. The overhang of regulatory uncertainty that depressed valuations for years is lifting.
Property Sector Stabilisation
The property sector remains a concern. Real estate valuations are puzzlingly high given the ongoing stress — the PE for real estate is at the 98th percentile historically. That suggests either a speculative bubble or a misreading of the data. We are cautious on property.
However, the worst of the property crisis appears to be behind us. Defaults have been contained. The government has backstopped the most systemically important developers. The sector is not fixed, but it is no longer falling apart.
Central Government Funding as a Backstop
JP Morgan notes that "central government-backed funding serves as a critical backstop" for Chinese equities. This is a distinctly Chinese feature. When private demand falters, state-owned enterprises and government-funded infrastructure projects can fill the gap. This puts a floor under the market that does not exist in other countries.
Part Seven: Putting It All Together — The Weight of Evidence for China
Let us score China across our four pillars, just as we do for global markets.
Monetary indicators: Moderately supportive. M2 is growing at 8.5 percent. The M2-M1 gap is narrowing. The People's Bank of China remains accommodative. Verdict: Slightly bullish.
Economic indicators: Mixed but improving. Manufacturing is expanding. Exports are recovering. Services are soft but not collapsing. Verdict: Neutral to slightly bullish.
Valuation indicators: Attractive relative to the US, less attractive relative to China's own history in some indices. Significant dispersion across sectors creates selective opportunities. Verdict: Neutral (bullish on specific sectors, cautious on expensive tech).
Technical indicators: Constructive. The CSI 300 is above its key moving averages. Trend signals are positive. Breadth is improving. Verdict: Bullish leaning.
Weight of evidence: The balance leans positive, but with important caveats. This is not a "go all in" signal. It is a "selectively add exposure, favour value sectors over expensive tech, and respect the policy environment" signal.
Part Eight: JP Morgan's View — A Useful Benchmark
We do not simply adopt other firms' views, but we pay attention when a major global bank publishes a detailed China outlook.
JP Morgan recently reiterated its base-case end-2026 targets of 100 points for the MSCI China Index (implying 30 percent upside) and 5200 points for the CSI 300 Index (implying 17 percent upside). Under a bear case, they see 80 points and 4000 points, respectively.
Their favoured themes are instructive. They like energy security — including new energy vehicles, energy storage systems, power equipment, and aluminium. They like artificial intelligence and robotics. They are selective on consumption, focusing on younger generation demand for physical and mental health products. They are cautious on export-oriented stocks not related to these themes, citing global stagflation risks and US tariff investigations.
Their top picks include BYD Company (new energy vehicles), NAURA (semiconductor equipment), Bank of China (financials), Innovent Bio (healthcare), and CNOOC (energy).
We share much of this framework. The themes align with our global views. The caution on exports is consistent with our bearish roadmap for Western markets.
Part Nine: The 12-Month Market Roadmap for Chinese Equities — Month by Month
Given the weight of evidence described above, here is our probabilistic roadmap for Chinese equities over the next 12 months. We are presenting this as a guide, not a prediction.
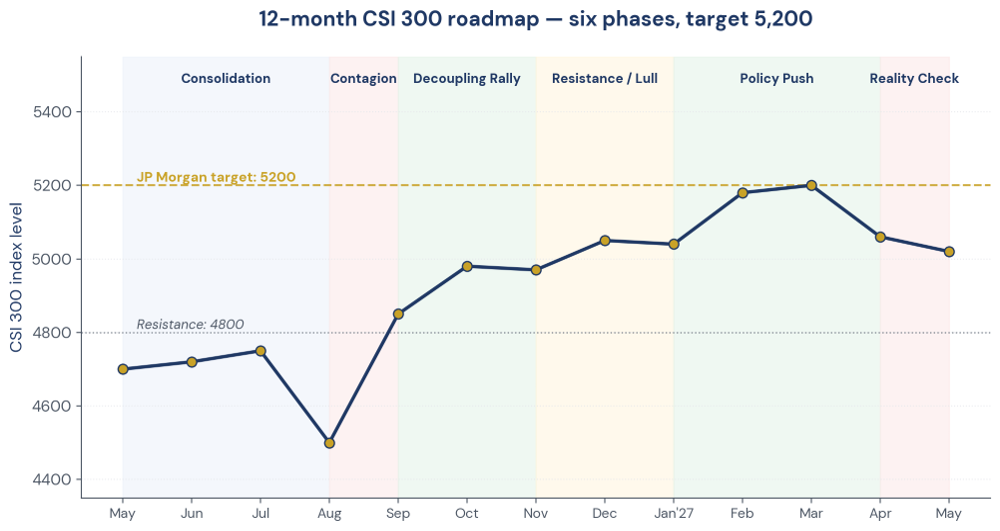 Figure 6. 12-month CSI 300 roadmap — six phases, target 5,200 by March 2027.
Month 1 — May 2026: The Consolidation
The CSI 300 trades in a range between 4600 and 4800. Manufacturing data remains expansionary. Services data remains soft. The market digests April's PMI figures. No major policy moves from Beijing. Our positioning: Neutral to slightly long. Selective buying in food and beverage and agriculture. Avoiding expensive real estate and overvalued tech.
Month 2 — June 2026: The Policy Reassurance
The People's Bank of China signals continued support. Another small reserve requirement ratio cut is possible. Liquidity remains ample. Market edges higher. Our positioning: Adding modestly to non-bank financials and healthcare. Maintaining cash for volatility.
Month 3 — July 2026: The Earnings Season Test
First-half earnings reports begin to flow. Manufacturing companies show strength. Consumer companies show weakness. Divergence widens. The market rewards earnings beats and punishes misses harshly. Our positioning: Holding. Not adding. Watching for companies that beat and raise guidance.
Month 4 — August 2026: The Global Contagion Check
Global markets begin to roll over as our bearish roadmap for the West plays out. Chinese equities are not immune. They sell off initially, but less than the S&P 500. The divergence begins. Our positioning: Opportunistic. Buying quality Chinese names on dips created by global panic.
Month 5 — September 2026: The Decoupling Narrative
The narrative shifts. Investors begin to see China as a relative safe haven — cheaper valuations, policy support, no inflation problem. Capital flows rotate from West to East. CSI 300 breaks above 4800. Our positioning: Increasing allocation to China. Adding energy security and AI themes.
Month 6 — October 2026: The Infrastructure Push
Beijing announces a new round of infrastructure stimulus to offset global weakness. Railway, power equipment, and new energy vehicle sectors rally. The CSI 300 approaches 5000. Our positioning: Fully allocated to China within our emerging markets bucket. Taking profits on the most extended names.
Month 7 — November 2026: The Consolidation
The market pauses. 5000 is psychological resistance. Volume dries up. Investors wait for confirmation of earnings recovery. Our positioning: Holding. Not adding. Tightening stops.
Month 8 — December 2026: The Year-End Rally
Liquidity is seasonally strong. Institutional investors window-dress performance. The CSI 300 breaks above 5000 on low volume. The move feels technical, not fundamental. Our positioning: Cautious. Beginning to trim. The rally may be exhausted.
Month 9 — January 2027: The Lunar New Year Lull
Trading volume drops as the Lunar New Year approaches. Markets drift sideways. No major news. Our positioning: Neutral. Holding core positions. No new initiations.
Month 10 — February 2027: The Policy Refresh
The National People's Congress standing committee meeting signals priorities for the coming year. Energy security, AI, and healthcare remain central. The market interprets this as confirmation. CSI 300 makes a run at 5200. Our positioning: Taking profits on the strongest performers. Moving to a more balanced stance.
Month 11 — March 2027: The Valuation Reality Check
The CSI 300 hits JP Morgan's 5200 target. Valuation multiples are no longer cheap. The easy money has been made. The market becomes choppy. Our positioning: Reducing China overweight to neutral. Locking in gains.
Month 12 — April 2027: The Wait-and-See
The global environment remains uncertain. Chinese equities have outperformed the US meaningfully over the previous 12 months. The question is whether the outperformance can continue. We are sceptical. We move to a market-weight position and wait for the next entry point. Our positioning: Neutral. Holding quality names with strong dividends. Cash ready for the next dip.
Part Ten: Sectors We Are Watching Closely
Within the Chinese market, we are not taking a blanket approach. We are being selective.
Energy Security and New Energy Vehicles (NEV)
This is our highest conviction theme. BYD has emerged as a global leader. The supply chain for electric vehicles, batteries, and energy storage systems is deeply integrated with Chinese manufacturing. This theme aligns with both global decarbonisation trends and China's strategic priorities. We are long this theme.
Artificial Intelligence and Robotics
China is racing to catch up to the United States in AI. The government is providing funding and regulatory support. Companies like NAURA (semiconductor equipment) are direct beneficiaries. We are selectively long, but we are cautious on valuation — the STAR 50 is expensive by historical standards.
Healthcare and Biotech
Innovent Bio and other biotech names have been beaten down by regulatory uncertainty and slower consumption. Valuations are now attractive. The demographic trend — an ageing population — is undeniable. We are building a position slowly.
Food and Beverage
This sector trades near decade-low valuations. The market has priced in a consumer slowdown that may be overdone. We are nibbling. This is a defensive, dividend-paying, low-beta way to gain exposure.
Sectors We Are Avoiding
Real estate — the valuations make no sense given the fundamental stress. Export-oriented consumer goods — too exposed to global recession risk. Overvalued tech with no earnings — the STAR 50 has run too far, too fast.
Part Eleven: Risks We Are Monitoring
Geopolitical escalation
The Iran war could widen. The United States could impose further tariffs on Chinese goods. Taiwan remains a flashpoint. Any of these could trigger a sharp sell-off. We maintain cash to buy such a sell-off, not to panic sell into it.
Property sector relapse
We said the worst appears behind us. "Appears" is the key word. If a major developer defaults unexpectedly, contagion could spread. We are underweight the sector.
Deflation, not inflation
China's problem is weak demand, not strong demand. If consumer confidence does not recover, the economy could slip into deflation. That would be bearish for equities. We are watching retail sales and consumer sentiment data closely.
Policy reversal
Beijing could decide that market speculation has gone too far and reintroduce regulatory curbs. This is impossible to predict. We respect it by maintaining diversification across regions and sectors.
Part Twelve: What We Are Doing Now — Current Positioning
Based on the current weight of evidence, here is our current positioning in Chinese equities.
Overall exposure: We are approximately 5 percent overweight China relative to our strategic benchmark. This is a moderate overweight, not an aggressive one.
Figure 6. 12-month CSI 300 roadmap — six phases, target 5,200 by March 2027.
Month 1 — May 2026: The Consolidation
The CSI 300 trades in a range between 4600 and 4800. Manufacturing data remains expansionary. Services data remains soft. The market digests April's PMI figures. No major policy moves from Beijing. Our positioning: Neutral to slightly long. Selective buying in food and beverage and agriculture. Avoiding expensive real estate and overvalued tech.
Month 2 — June 2026: The Policy Reassurance
The People's Bank of China signals continued support. Another small reserve requirement ratio cut is possible. Liquidity remains ample. Market edges higher. Our positioning: Adding modestly to non-bank financials and healthcare. Maintaining cash for volatility.
Month 3 — July 2026: The Earnings Season Test
First-half earnings reports begin to flow. Manufacturing companies show strength. Consumer companies show weakness. Divergence widens. The market rewards earnings beats and punishes misses harshly. Our positioning: Holding. Not adding. Watching for companies that beat and raise guidance.
Month 4 — August 2026: The Global Contagion Check
Global markets begin to roll over as our bearish roadmap for the West plays out. Chinese equities are not immune. They sell off initially, but less than the S&P 500. The divergence begins. Our positioning: Opportunistic. Buying quality Chinese names on dips created by global panic.
Month 5 — September 2026: The Decoupling Narrative
The narrative shifts. Investors begin to see China as a relative safe haven — cheaper valuations, policy support, no inflation problem. Capital flows rotate from West to East. CSI 300 breaks above 4800. Our positioning: Increasing allocation to China. Adding energy security and AI themes.
Month 6 — October 2026: The Infrastructure Push
Beijing announces a new round of infrastructure stimulus to offset global weakness. Railway, power equipment, and new energy vehicle sectors rally. The CSI 300 approaches 5000. Our positioning: Fully allocated to China within our emerging markets bucket. Taking profits on the most extended names.
Month 7 — November 2026: The Consolidation
The market pauses. 5000 is psychological resistance. Volume dries up. Investors wait for confirmation of earnings recovery. Our positioning: Holding. Not adding. Tightening stops.
Month 8 — December 2026: The Year-End Rally
Liquidity is seasonally strong. Institutional investors window-dress performance. The CSI 300 breaks above 5000 on low volume. The move feels technical, not fundamental. Our positioning: Cautious. Beginning to trim. The rally may be exhausted.
Month 9 — January 2027: The Lunar New Year Lull
Trading volume drops as the Lunar New Year approaches. Markets drift sideways. No major news. Our positioning: Neutral. Holding core positions. No new initiations.
Month 10 — February 2027: The Policy Refresh
The National People's Congress standing committee meeting signals priorities for the coming year. Energy security, AI, and healthcare remain central. The market interprets this as confirmation. CSI 300 makes a run at 5200. Our positioning: Taking profits on the strongest performers. Moving to a more balanced stance.
Month 11 — March 2027: The Valuation Reality Check
The CSI 300 hits JP Morgan's 5200 target. Valuation multiples are no longer cheap. The easy money has been made. The market becomes choppy. Our positioning: Reducing China overweight to neutral. Locking in gains.
Month 12 — April 2027: The Wait-and-See
The global environment remains uncertain. Chinese equities have outperformed the US meaningfully over the previous 12 months. The question is whether the outperformance can continue. We are sceptical. We move to a market-weight position and wait for the next entry point. Our positioning: Neutral. Holding quality names with strong dividends. Cash ready for the next dip.
Part Ten: Sectors We Are Watching Closely
Within the Chinese market, we are not taking a blanket approach. We are being selective.
Energy Security and New Energy Vehicles (NEV)
This is our highest conviction theme. BYD has emerged as a global leader. The supply chain for electric vehicles, batteries, and energy storage systems is deeply integrated with Chinese manufacturing. This theme aligns with both global decarbonisation trends and China's strategic priorities. We are long this theme.
Artificial Intelligence and Robotics
China is racing to catch up to the United States in AI. The government is providing funding and regulatory support. Companies like NAURA (semiconductor equipment) are direct beneficiaries. We are selectively long, but we are cautious on valuation — the STAR 50 is expensive by historical standards.
Healthcare and Biotech
Innovent Bio and other biotech names have been beaten down by regulatory uncertainty and slower consumption. Valuations are now attractive. The demographic trend — an ageing population — is undeniable. We are building a position slowly.
Food and Beverage
This sector trades near decade-low valuations. The market has priced in a consumer slowdown that may be overdone. We are nibbling. This is a defensive, dividend-paying, low-beta way to gain exposure.
Sectors We Are Avoiding
Real estate — the valuations make no sense given the fundamental stress. Export-oriented consumer goods — too exposed to global recession risk. Overvalued tech with no earnings — the STAR 50 has run too far, too fast.
Part Eleven: Risks We Are Monitoring
Geopolitical escalation
The Iran war could widen. The United States could impose further tariffs on Chinese goods. Taiwan remains a flashpoint. Any of these could trigger a sharp sell-off. We maintain cash to buy such a sell-off, not to panic sell into it.
Property sector relapse
We said the worst appears behind us. "Appears" is the key word. If a major developer defaults unexpectedly, contagion could spread. We are underweight the sector.
Deflation, not inflation
China's problem is weak demand, not strong demand. If consumer confidence does not recover, the economy could slip into deflation. That would be bearish for equities. We are watching retail sales and consumer sentiment data closely.
Policy reversal
Beijing could decide that market speculation has gone too far and reintroduce regulatory curbs. This is impossible to predict. We respect it by maintaining diversification across regions and sectors.
Part Twelve: What We Are Doing Now — Current Positioning
Based on the current weight of evidence, here is our current positioning in Chinese equities.
Overall exposure: We are approximately 5 percent overweight China relative to our strategic benchmark. This is a moderate overweight, not an aggressive one.
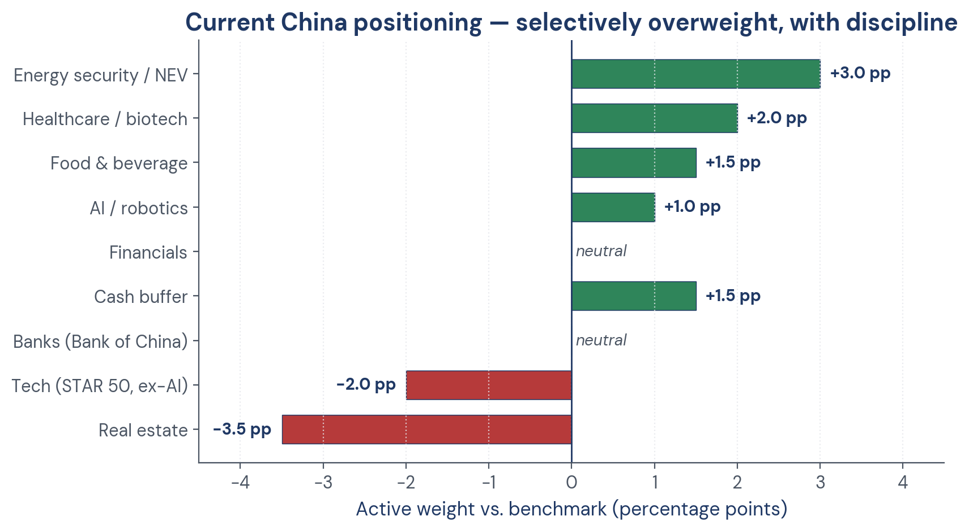 Figure 7. Current China positioning — overweight value and structural themes, underweight real estate and unprofitable tech.
Within China: We are overweight energy security (BYD, CNOOC), healthcare (Innovent Bio), and food and beverage. We are market-weight financials (Bank of China). We are underweight real estate and overvalued technology.
Implementation: We are using a mix of direct Hong Kong-listed H-shares, Shanghai-listed A-shares where accessible, and China-focused ETFs for broader exposure.
Hedging: We hold put options on the CSI 300 as a tail hedge. The cost is low. The protection is valuable.
Cash: We hold 15 to 20 percent cash within our China sleeve. This is higher than normal. We want dry powder for the inevitable volatility.
Part Thirteen: Frequently Asked Questions From Clients
Is China investable given the geopolitical risks?
Yes, but with eyes wide open. The risks are real. The potential returns are also real. We size positions accordingly and diversify across regions.
Are you concerned about the property sector?
Yes. That is why we are underweight it. But we also recognise that the property sector is not the entire economy. Manufacturing, energy, and technology are growing. We focus there.
What is the single biggest risk to your China thesis?
A sharp global recession that crushes export demand. China's manufacturing recovery depends on global demand. If the West falls into a deep recession, Chinese exports will suffer. That is why we are monitoring our bearish global roadmap closely. If the West crashes, China will not be immune.
What would make you more bullish on China?
A sustained recovery in domestic consumption. If retail sales growth accelerates and services PMI moves back above 50 decisively, we will increase our overweight.
What would make you less bullish?
A spike in US-China trade tensions, a property sector relapse, or a sharp renminbi devaluation. Any of these would cause us to reassess.
Part Fourteen: The Rules We Apply to China
The same rules that govern our global investing apply to China.
We do not fight the tape. If Chinese markets roll over technically, we will reduce exposure regardless of valuation.
We watch extremes in sentiment. When everyone is bullish on China, we get cautious. When everyone is bearish, we get interested. Sentiment is currently neutral — neither extreme.
We cut losses short. Every Chinese position has a stop loss.
We let profits run. When we are right on a theme like energy security, we stay with it.
We study history. China has had booms and busts. We learn from both.
We remain humble. China is complex. We will make mistakes. The goal is positive expectancy over time, not perfection.
Closing Thoughts
Chinese equities occupy a unique place in the global investment landscape. They are cheaper than the United States. They are supported by a central bank that is easing, not tightening. They have a policy backstop that Western markets lack. And they are benefiting from a manufacturing recovery that is the envy of the developed world.
But they are not without risks. Geopolitics, property, and weak domestic consumption are real headwinds. And the valuation dispersion across sectors is extreme — some areas are genuinely cheap, others are dangerously expensive.
Our approach is selective. We favour energy security, AI and robotics, healthcare, and food and beverage. We avoid real estate and overvalued tech. We maintain higher than normal cash. And we watch the technical signals closely.
We are not predicting a Chinese super-cycle. We are not predicting a crash. We are positioning for a moderate overweight based on the weight of evidence, with clear triggers to add or reduce as conditions change.
As always, we remain vigilant, not fearful. We follow the data. We trust the process. And we keep you informed every step of the way.
Thank you for your trust.
The Investment Team
May 2026
Figure 7. Current China positioning — overweight value and structural themes, underweight real estate and unprofitable tech.
Within China: We are overweight energy security (BYD, CNOOC), healthcare (Innovent Bio), and food and beverage. We are market-weight financials (Bank of China). We are underweight real estate and overvalued technology.
Implementation: We are using a mix of direct Hong Kong-listed H-shares, Shanghai-listed A-shares where accessible, and China-focused ETFs for broader exposure.
Hedging: We hold put options on the CSI 300 as a tail hedge. The cost is low. The protection is valuable.
Cash: We hold 15 to 20 percent cash within our China sleeve. This is higher than normal. We want dry powder for the inevitable volatility.
Part Thirteen: Frequently Asked Questions From Clients
Is China investable given the geopolitical risks?
Yes, but with eyes wide open. The risks are real. The potential returns are also real. We size positions accordingly and diversify across regions.
Are you concerned about the property sector?
Yes. That is why we are underweight it. But we also recognise that the property sector is not the entire economy. Manufacturing, energy, and technology are growing. We focus there.
What is the single biggest risk to your China thesis?
A sharp global recession that crushes export demand. China's manufacturing recovery depends on global demand. If the West falls into a deep recession, Chinese exports will suffer. That is why we are monitoring our bearish global roadmap closely. If the West crashes, China will not be immune.
What would make you more bullish on China?
A sustained recovery in domestic consumption. If retail sales growth accelerates and services PMI moves back above 50 decisively, we will increase our overweight.
What would make you less bullish?
A spike in US-China trade tensions, a property sector relapse, or a sharp renminbi devaluation. Any of these would cause us to reassess.
Part Fourteen: The Rules We Apply to China
The same rules that govern our global investing apply to China.
We do not fight the tape. If Chinese markets roll over technically, we will reduce exposure regardless of valuation.
We watch extremes in sentiment. When everyone is bullish on China, we get cautious. When everyone is bearish, we get interested. Sentiment is currently neutral — neither extreme.
We cut losses short. Every Chinese position has a stop loss.
We let profits run. When we are right on a theme like energy security, we stay with it.
We study history. China has had booms and busts. We learn from both.
We remain humble. China is complex. We will make mistakes. The goal is positive expectancy over time, not perfection.
Closing Thoughts
Chinese equities occupy a unique place in the global investment landscape. They are cheaper than the United States. They are supported by a central bank that is easing, not tightening. They have a policy backstop that Western markets lack. And they are benefiting from a manufacturing recovery that is the envy of the developed world.
But they are not without risks. Geopolitics, property, and weak domestic consumption are real headwinds. And the valuation dispersion across sectors is extreme — some areas are genuinely cheap, others are dangerously expensive.
Our approach is selective. We favour energy security, AI and robotics, healthcare, and food and beverage. We avoid real estate and overvalued tech. We maintain higher than normal cash. And we watch the technical signals closely.
We are not predicting a Chinese super-cycle. We are not predicting a crash. We are positioning for a moderate overweight based on the weight of evidence, with clear triggers to add or reduce as conditions change.
As always, we remain vigilant, not fearful. We follow the data. We trust the process. And we keep you informed every step of the way.
Thank you for your trust.
The Investment Team
May 2026
DISCLAIMER This newsletter is published for informational and educational purposes only. Nothing contained herein constitutes investment advice, a solicitation, or a recommendation to buy or sell any financial instrument. All investment involves risk, including the loss of principal. Past commentary does not guarantee future results. Any views expressed are those of the author as of the date of publication and are subject to change without notice. Please consult a licensed financial advisor before making any investment decisions. |