Macro Analysis
Risk Assessment & Market Roadmap
*Reading the Weight of the Evidence*
Bull, Bear, Bust · 26 May 2026 · 19 min read
MONTHLY RESEARCH · RISK ASSESSMENT
Bull, Bear, Bust · The Monthly Macro Memo · May 2026
Every month, we sit down with our proprietary dashboard of market indicators. We do not guess. We do not hope. We look at the data. We look at history. And we look at what the cold, bloodless verdict of the market is telling us.
This report serves two purposes. First, we want to educate you on how we think about risk. Second, we want to show you exactly what our indicators are saying right now and how that translates into our roadmap for the next 12 months.
This is not a recommendation to buy or sell anything. It is a transparent explanation of our process and our current positioning.
Let us begin.
KEY POINTS A quick-read snapshot of this newsletter's commentary
▸ We assess risk through the MEVT framework: Monetary, Economic, Valuation, and Technical pillars. Three of the four currently lean bearish; the fourth is cautious. ▸ Monetary conditions are tightening: liquidity is draining, the Three-Steps-and-a-Stumble rule has triggered, and the yield curve has un-inverted — a historical recession signal. ▸ Economic data is rolling over: the Leading Economic Indicators are declining and the Sahm Rule has triggered, with no false signals since 1970. ▸ Valuations are at extremes: the Buffett Indicator sits near 200% and the Shiller CAPE is above 30 — levels matched only before 2000 and 2008. ▸ Technicals are flashing caution: breadth is narrow, complacency is high, and credit spreads are widening. ▸ Our 12-month roadmap calls for a Storm phase (May–Oct 2026), a Bottoming phase (Nov 2026–Jan 2027), and a Recovery phase from Feb 2027 onward. ▸ Current positioning: equities 40–50% (down from ~78% six months ago); cash 20–25%; gold 5–10%; emphasis on defensive sectors and non-US markets. ▸ We are positioned defensively. We will be aggressive buyers when the selling climax and Fed-panic signals arrive — not before. |
Part One: The Philosophy — Why We Watch These Indicators
Before we dive into the numbers, it is worth understanding why we focus on these specific indicators in the first place.
Most investors spend their time watching price. They look at the S&P 500, the NASDAQ, or their favourite stock, and they assume that if the price is going up, everything is fine. If the price is going down, they panic.
We take a different view. Price is a lagging indicator. By the time the price has fallen significantly, the damage is already done. Our job is to identify the conditions that precede major market moves — both up and down — before those moves fully unfold.
That is why we watch monetary conditions, economic trends, valuation extremes, and technical internals. These four pillars — which we call MEVT — tell us whether the environment is supportive of risk-taking or whether we should be moving to the sidelines.
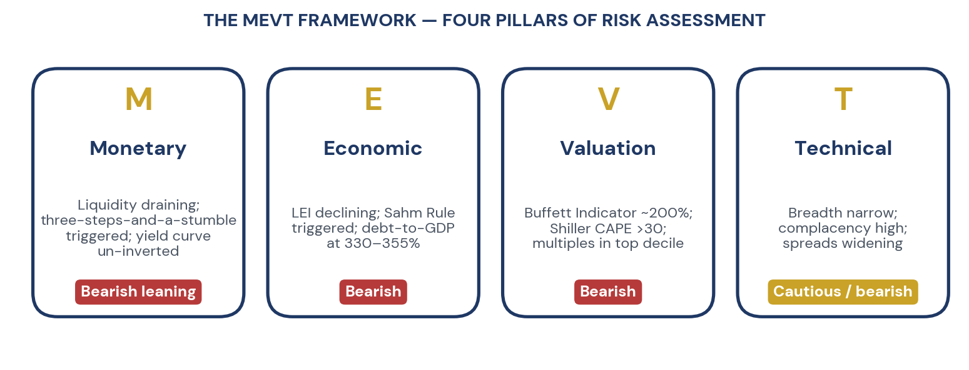 Figure 1. The MEVT framework — four pillars of risk assessment, with current verdicts.
Our philosophy is simple. We do not fight the Fed. We do not fight the tape. We pay attention to crowds at extremes. And we apply strict money management rules to every position we take.
With that foundation in place, let us look at where each indicator stands today.
Part Two: Monetary Indicators — The Fuel for the Fire
Monetary indicators tell us how much fuel is available to propel asset prices higher. Central banks control the spigot. When they are opening it — cutting rates, expanding their balance sheets, pumping liquidity — risk assets tend to rise. When they are closing it — raising rates, shrinking their balance sheets — the fuel runs out.
Here is what our monetary dashboard is showing us right now.
Real M2 minus Industrial Production
This indicator measures the amount of money sloshing around the economy relative to real economic activity. When this number is high and rising, liquidity is abundant. When it is falling, the punchbowl is being removed.
Currently, this indicator is negative. The rate of change has turned down meaningfully over the past six months. Historically, when liquidity contracts like this, risk assets struggle to sustain valuations. The average market gain when liquidity is positive is approximately 13 percent per annum. When liquidity is deeply negative, the average market decline is approximately 5 percent per annum. We are now in the latter camp.
Real Fed Liquidity Index
This is a broader measure of central bank liquidity, incorporating both the Fed's balance sheet and bank reserves. The current reading is draining. The Fed is no longer adding fuel to the fire. In fact, they are actively removing fuel.
Three Steps and a Stumble
This is one of our oldest and most reliable monetary rules. It tracks changes in the US discount rate. When the Fed raises rates three times in a tightening cycle, the market tends to stumble. We have seen more than 40 such signals since 1910. Only seven were early or late. The rest worked.
The signal has now triggered. We are in the stumble window. This does not mean the market crashes tomorrow. But it does mean the probability of a significant correction over the next 6 to 12 months is historically elevated.
Yield Curve (3-month versus 10-year Treasury)
The yield curve has been inverted for an extended period. More recently, it has begun to un-invert. That may sound like good news, but history tells us something different. The recession almost always arrives after the curve un-inverts, not during the inversion itself. The lag is typically 6 to 12 months.
We are now in that lag window. The recession signal is flashing.
Junk Bond to A Rated Bond Spreads
When investors are confident, they demand very little extra yield to hold risky high-yield bonds. When they are worried, spreads widen. Our dashboard watches the spread between junk bonds and high-quality A rated bonds.
Currently, spreads are widening. They are not yet at crisis levels — the 4.5 percent threshold we watch closely has not been breached. But the trend is moving in the wrong direction. Widening spreads are an early warning of deteriorating credit conditions and, eventually, equity market stress.
Summary of Monetary Indicators
Of the monetary indicators we track, the majority are now flashing caution or outright warning. The liquidity tide is going out. The Fed is not your friend right now. And the bond market is starting to price in stress.
This is not an environment where we take aggressive risk. This is an environment where we prioritise capital preservation and liquidity.
Part Three: Economic Indicators — The Health of the Patient
Monetary indicators tell us about the fuel. Economic indicators tell us about the engine. Even if there is plenty of fuel, if the engine is breaking down, you are not going anywhere.
Here is what our economic dashboard is showing.
Leading Economic Indicators (LEI)
The LEI is a composite of ten forward-looking data points, including manufacturing orders, building permits, and consumer expectations. It is designed to anticipate turning points in the economy by 6 to 12 months.
The current reading is negative. The LEI has been declining for several consecutive months. Historically, an extended decline in the LEI has preceded every recession in the post-war period. We are not yet at the depths seen before the 2008 crisis, but the direction is clear. The economy is slowing.
Sahm Rule Recession Indicator
The Sahm Rule is a real-time recession indicator developed by former Fed economist Claudia Sahm. It triggers when the three-month moving average of the unemployment rate rises by 0.5 percentage points or more relative to its low over the previous 12 months.
This indicator has now triggered. Every time it has triggered since 1970, the economy has been either in a recession or entering one within months. There have been no false signals.
We take this indicator very seriously. It is not a forecasting model. It is a description of what is already happening. The labour market is softening. The trigger is now pulled.
Global Debt to GDP
This is a structural indicator rather than a cyclical one. But it matters enormously for the severity of any downturn.
Global debt to GDP currently stands at approximately 330 to 355 percent. At the time of the Global Financial Crisis, it was 205 percent. We are carrying a much heavier debt load today than we were in 2008.
High debt does not cause recessions by itself. But it amplifies them. When the economy slows, highly indebted companies and households cannot service their obligations. Defaults rise. Banks tighten lending. The downdraft accelerates.
This is the elephant in the room that most market commentary ignores. We do not ignore it. It is a key reason we maintain higher cash balances than many of our peers.
Consumer Confidence
The Conference Board's Consumer Confidence Index has shown signs of cracking. High inflation, elevated interest rates, and geopolitical uncertainty are weighing on sentiment. When consumers become nervous, they pull back on spending. Since consumer spending drives roughly two-thirds of economic activity, this matters.
Summary of Economic Indicators
The economic dashboard is flashing amber with some red lights. The LEI is pointing down. The Sahm Rule has triggered. Debt levels are historically high. Consumer confidence is wobbling.
We are not forecasting a depression. But we are forecasting a high probability of a recession within the next 6 to 12 months. Our asset allocation reflects that view.
Part Four: Valuation Indicators — How Much Are You Paying?
Valuation indicators tell us how much investors are paying for a dollar of earnings, a dollar of sales, or a dollar of book value. They do not tell us when the market will turn — overvalued markets can stay overvalued for years. But they do tell us about the range of likely long-term returns and the severity of potential drawdowns.
Buffett Indicator — Market Cap to GDP
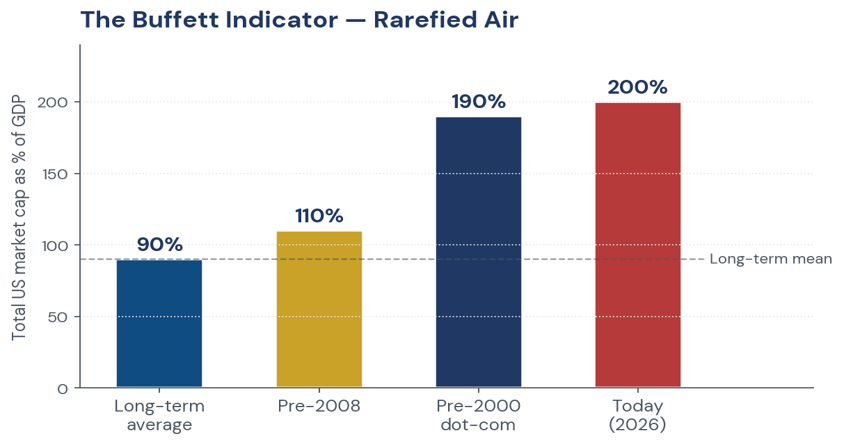 Figure 2. The Buffett Indicator — today's reading sits among the most extreme on record.
This is the single most important valuation indicator on our dashboard. It compares the total value of the US stock market to the size of the US economy.
The current reading is approximately 190 to 200 percent. The historical average is approximately 80 to 100 percent. We have only seen levels this high three times before — before the 2000 dot-com crash, before the 2008 financial crisis, and before the 2022 bear market.
Every time the Buffett Indicator has exceeded 150 percent, subsequent 10-year returns from equities have been low to negative. At 200 percent, the implied long-term return is deeply negative unless earnings grow at an unprecedented pace.
We cannot predict the exact timing of the mean reversion. But we can say with high confidence that the next 10-year return from current levels is likely to be significantly below the historical average — and possibly negative in real terms.
Price to Cash Flow, Price to Earnings, Price to Book
We track a range of valuation multiples, not just one. Currently, most of them are in the top decile of historical readings. Price to sales ratios are at all-time highs. Shiller CAPE is above 30, versus a long-term average of 17.
When valuations are this extreme, the market is priced for perfection. Any disappointment — in earnings, in growth, in geopolitics — can trigger a sharp repricing.
Summary of Valuation Indicators
The valuation dashboard is flashing red. Not amber. Red. We are in rarefied air historically. This does not guarantee a crash. But it does mean that the margin of safety is very thin. We are not betting heavily on continued multiple expansion from these levels.
Part Five: Technical Indicators — What Is the Market Actually Doing?
Fundamentals and valuations tell us how the market should be acting. Technicals tell us how the market is actually acting. When the two diverge, we follow the tape.
Here is what our technical dashboard is showing.
Market Breadth
Breadth measures how many stocks are participating in a market move. A healthy rally has broad participation. An unhealthy rally is driven by a handful of mega-cap stocks while most stocks lag.
Current breadth is narrow. Very narrow. A small number of large-cap technology stocks have been holding the indices aloft while the average stock has stagnated or fallen. This is characteristic of late-stage bull markets. It is not characteristic of healthy new uptrends.
NDR High/Low Logic
This indicator tracks the relationship between new highs and new lows. When new highs dominate, the market is healthy. When new lows begin to accumulate, trouble is brewing.
Currently, the reading is neutral with negative divergences. We are not yet at panic levels. But the trend is deteriorating.
Volatility (VIX)
The VIX, often called the fear index, measures implied volatility in the options market. Periods of very low volatility tend to be followed by periods of very high volatility. The lower the VIX goes, the more complacent investors become — and the more vulnerable the market is to a shock.
The VIX has been relatively subdued. That complacency is a warning sign.
Junk Spreads (Technical Aspect)
We mentioned spreads in the monetary section. Technically, widening spreads are a leading indicator for equities. The trend is currently widening.
Summary of Technical Indicators
The technical dashboard is not screaming panic. But it is flashing caution. Breadth is poor. Complacency is high. The internals are deteriorating even as headline indices hold up.
This is often the prelude to a significant market move. And given the weight of evidence from monetary, economic, and valuation indicators, we believe the next significant move is more likely to be down than up.
Part Six: Putting It All Together — The Weight of the Evidence
We do not make decisions based on any single indicator. We look at the weight of the evidence across all four pillars.
Here is the current scorecard.
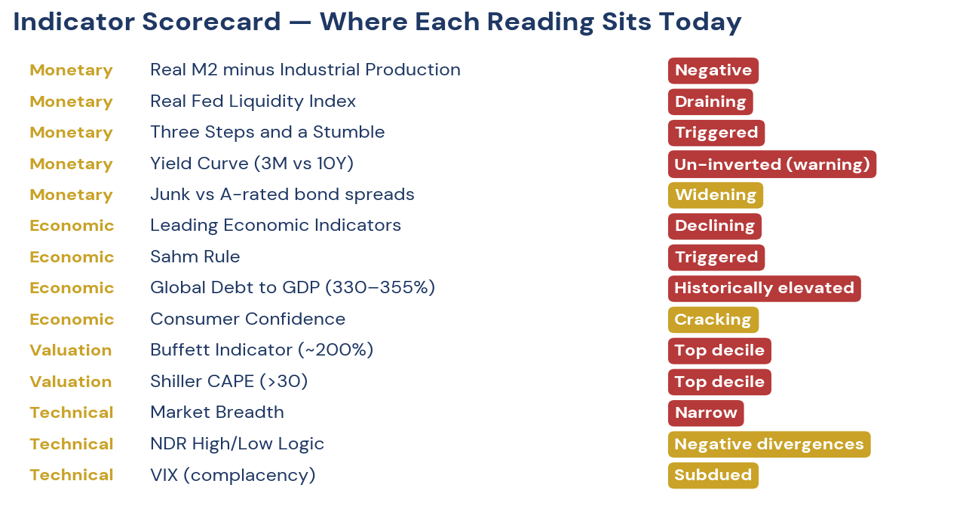 Figure 3. Indicator scorecard — where each reading sits today.
Monetary indicators — the fuel. Most are flashing caution or warning. The Fed is tightening. Liquidity is draining. The yield curve has un-inverted, historically a recession signal. Verdict: Bearish leaning.
Economic indicators — the engine. Leading indicators are declining. The Sahm Rule has triggered. Debt levels are historically high. Verdict: Bearish.
Valuation indicators — the price. Buffett Indicator is at 200 percent. Multiples are in the top decile. Verdict: Bearish.
Technical indicators — the tape. Breadth is narrow. Complacency is high. Internals are deteriorating. Verdict: Cautious leaning bearish.
When three of the four pillars lean bearish, and the fourth is at least cautious, the weight of evidence is clear. We are not in a "buy everything" environment. We are in a "be selective, maintain liquidity, and wait for better opportunities" environment.
We are not in a "buy everything" environment. We are in a "be selective, maintain liquidity, and wait for better opportunities" environment.
Part Seven: The 12-Month Market Roadmap — Month by Month
Given the weight of evidence described above, here is our probabilistic roadmap for the next 12 months. We are presenting this as a guide, not a prediction. Markets are complex and surprises happen. But based on history and our indicators, this is the most likely path.
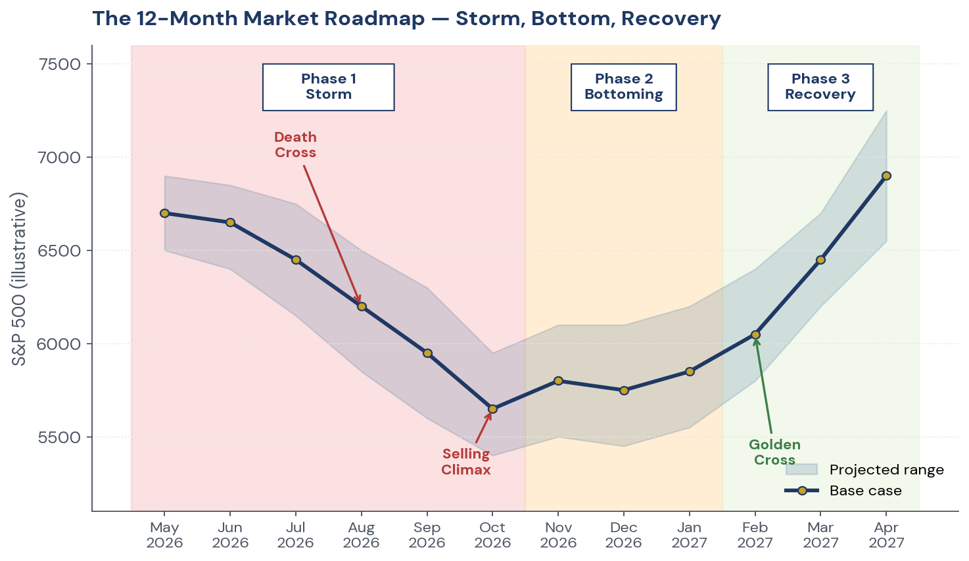 Figure 4. Twelve-month roadmap — Storm, Bottoming, Recovery.
Month 1 — May 2026: The Calm Before
The market remains range-bound. Breadth continues to narrow. A few mega-cap names hold up the indices while the average stock drifts. Volatility is low. Complacency is high. Most investors believe the soft landing has been achieved.
Our positioning: Defensive. Higher cash. Short duration bonds. Avoiding marginal stocks.
Month 2 — June 2026: The First Crack
Economic data softens. A regional bank or highly leveraged corporate borrower shows stress. The market shrugs it off as idiosyncratic. But the tone changes. Trading volume increases on down days.
Our positioning: Raising cash further. Tightening stops.
Month 3 — July 2026: The Rollover Begins
Leading indicators roll over decisively. The Sahm Rule trigger is now widely discussed. The Fed holds rates steady but offers no comfort. The market breaks below its 200-day moving average.
Our positioning: Maximum defensive posture. Cash 25 to 30 percent. Shorting the weakest sectors.
Month 4 — August 2026: The Death Cross
The 50-day moving average crosses below the 200-day moving average on the S&P 500. The Death Cross. This is a lagging but reliable bear market confirmation. Sentiment shifts from hope to worry.
Our positioning: Holding shorts. No new equity purchases.
Month 5 — September 2026: The Panic
A significant default or credit event occurs. Spreads blow out. The VIX spikes above 30. The market falls 5 to 8 percent in a matter of days. Margin calls force indiscriminate selling — good stocks and bad stocks fall together.
Our positioning: Watching for capitulation volume. Not yet buying.
Month 6 — October 2026: The Selling Climax
Volume spikes to two or three times the average. The market gaps down, then reverses sharply on the same day. This is the selling climax — the moment when the last sellers finally throw in the towel. The bottom may be near.
Our positioning: Beginning to cover shorts. Looking for high quality names trading at distressed valuations.
Month 7 — November 2026: The False Dawn
The market rallies off the lows. Investors call it a V-shaped recovery. But breadth does not confirm. The rally fails. We retest the lows.
Our positioning: Cautious. Not committing large capital.
Month 8 — December 2026: The True Test
Economic data is now clearly recessionary. The Fed panics — an emergency 50 basis point cut. This is the signal we have been waiting for. The market hesitates, then begins to climb.
Our positioning: Initiating long positions in oversold quality growth stocks.
Month 9 — January 2027: The Base Builds
The market trades sideways. Every rally is sold. Every dip is bought. A base is forming. Breadth begins to improve. The number of stocks above their 50-day moving average rises steadily.
Our positioning: Increasing equity allocation. Adding to non-US markets.
Month 10 — February 2027: The Confirmation
The 50-day moving average crosses back above the 200-day moving average — the Golden Cross. This confirms that the bear market is over. The weight of evidence turns bullish.
Our positioning: Fully allocated. Aggressive on CANSLIM breakouts.
Month 11 — March 2027: The New Uptrend
Leadership is broad. Small caps lead. Cyclical sectors outperform. The advance is accompanied by rising volume. This is the beginning of the next bull market.
Our positioning: Riding the trend. Letting winners run.
Month 12 — April 2027: The Renewed Optimism
Sentiment shifts from despair to hope. Investors who sold at the bottom are now scrambling to get back in. The market makes new highs. We are at the start of a new cycle.
Our positioning: Holding. Watching for the first signs of euphoria — but that is a concern for next year's report.
Part Eight: What We Are Doing Now
Based on the current weight of evidence, here is our current positioning in plain English.
Figure 5. Current portfolio positioning — markedly de-risked vs six months ago.
Equities: We are significantly underweight relative to our strategic benchmark. Our equity allocation is in the 40 to 50 percent range, down from 75 to 80 percent six months ago. The equity we do hold is concentrated in defensive sectors — healthcare, consumer staples, energy — and non-US markets including Japan and Europe ex-UK. We have minimal exposure to US technology.
Fixed Income: We are overweight short to intermediate term bonds, particularly high quality municipals and short-term Treasuries. We have avoided long duration bonds. We have reduced our exposure to high yield and emerging market debt.
Gold: We hold a modest gold position (5 to 10 percent). Gold is not a growth asset. It is a hedge against central bank policy mistakes and geopolitical shocks.
Cash: Cash is the most underrated asset in a dangerous environment. We are holding 20 to 25 percent cash. This gives us the optionality to buy when the selling climax arrives.
Shorts: We hold limited short positions on overvalued technology names and regional banks. These are not large positions. They are hedges.
Part Nine: Frequently Asked Questions From Clients
Are you forecasting a crash?
We assess probabilities. The weight of evidence suggests a higher than normal probability of a significant market decline over the next 6 to 12 months. We position accordingly.
Should I sell everything?
No. Market timing is extraordinarily difficult. Even the best indicators produce false signals. If you have a long-term portfolio that is properly diversified and you do not need the money for five to ten years, the worst thing you can do is panic sell at the bottom. Our positioning is for the fund. Your personal situation may be different. Please speak with your financial adviser.
When will you start buying again?
We will start buying aggressively when we see two things. First, a selling climax — a spike in volume on a sharp down day followed by an immediate reversal. Second, the Fed panicking — an emergency rate cut or a return to quantitative easing. Those are the traditional signals that a bear market bottom is in place. We are not there yet.
What if you are wrong and the market goes up from here?
That is always possible. If the market rallies from here without a correction, we will underperform. But the cost of being wrong is missing upside. The cost of being unprepared for a bear market is permanent capital loss. We choose to prioritise capital preservation. History suggests that is the right trade-off at current valuation extremes.
Part Ten: The Rules We Never Break
Before we close, we want to remind you of the rules that govern everything we do.
We do not fight the Fed. When the central bank is tightening, we are cautious. When they are easing, we are aggressive. Right now, they are tightening or pausing — not easing.
We do not fight the tape. If the market is going down, we do not pretend it is going up. We listen to price.
We watch crowds at extremes. When everyone is bullish, we get worried. When everyone is bearish, we get interested. Sentiment is not at capitulation levels yet.
We cut losses short. Every position has a stop loss. We do not let small losses become large losses.
We let profits run. When we are right, we stay with the trend. We do not take small profits and miss large moves.
We study history. Markets repeat because human behaviour repeats. We learn from what has happened before.
We remain humble. We have been wrong before. We will be wrong again. The goal is not to be perfect. The goal is to have a positive expectancy over a full market cycle.
Closing Thoughts
The next 12 months are likely to be volatile. The weight of evidence from monetary, economic, valuation, and technical indicators suggests that we are in a late-cycle environment with elevated recession risk. The Buffett Indicator is at 200 percent. The Sahm Rule has triggered. Liquidity is draining. Breadth is narrow.
None of this guarantees a crash. Markets can stay overvalued for years. But it does mean that the margin of safety is thin and the downside risk is significant.
We are positioned defensively. We are holding cash. We are waiting for the selling climax and the Fed panic that historically signal the end of bear markets. When those signals arrive, we will be aggressive buyers.
Until then, we remain vigilant, not fearful. We follow the data. We trust the process. And we keep our clients informed every step of the way.
DISCLAIMER This newsletter is published for informational and educational purposes only. Nothing contained herein constitutes investment advice, a solicitation, or a recommendation to buy or sell any financial instrument. All investment involves risk, including the loss of principal. Past commentary does not guarantee future results. Any views expressed are those of the author as of the date of publication and are subject to change without notice. Please consult a licensed financial advisor before making any investment decisions. |