United States Japan China
The Beacon Five Ultimate
Bull, Bear, Bust · 28 May 2026 · 25 min read
BEACON FIVE ULTIMATE · MARKET SCREENING
A Complete Market Screening Report
Bull, Bear, Bust · The BBB Team · Data as of May 2, 2026
Welcome to the Bull Bear Bust Newsletter. We are the BBB Team. Every week, we screen the three major markets — the United States, Japan, and China — using our proprietary model called the Beacon Five Ultimate.
This report is our full market screening as of May 2, 2026. We will explain everything we see, why we see it, and what it means. We do not give advice. We do not tell you what to do with your money. We educate. We inform. We share what the BBB Team is doing and seeing. Your decisions are your own.
Let us begin with a complete explanation of how our model works. Then we will show you the current scores for each market.
KEY POINTS A quick-read snapshot of this newsletter's commentary
▸ The Beacon Five Ultimate is our proprietary screening model. It combines five core lights (Tape, Sentiment, Monetary, Valuation, Regime) and six confirmation overlays into a single 0-10 composite score. ▸ Backtested batting averages: United States 92.1% since 1960, Japan 87.6% since 1970, China 83.9% since 1995. No model is perfect — but this is our most reliable tool. ▸ United States — composite 3.1, Bearish, red light. Four of five lights are red. Valuations extreme (Buffett 198%, CAPE 34.7). Liquidity draining. Breadth narrow. Sentiment complacent. ▸ Japan — composite 6.8, Bullish, green light. All five lights green. TOPIX trending. 72% of stocks above 50-day MA. Sentiment skeptical. Valuations reasonable. BoJ accommodative. ▸ China — composite 5.2, Neutral, yellow light. Sentiment and Valuation green. Tape, Monetary, Regime yellow. No reds. Cheap and washed out — waiting for confirmation. ▸ Two overlays triggered in the US: Sentiment Extreme (composite reduced by 1.5pts) and Liquidity Doubler (Monetary Light weight doubled). No overlays triggered for Japan or China. ▸ Ranked most to least favourable: 1st Japan (Bullish, 6.8); 2nd China (Neutral, 5.2); 3rd United States (Bearish, 3.1). ▸ This is an educational publication — not investment advice. The Beacon Five Ultimate has been wrong before and will be wrong again. We educate; you decide. |
Part One: What Is the Beacon Five Ultimate?
The Beacon Five Ultimate is our proprietary market screening tool. We built it over years of research and backtesting. It takes in over twenty separate pieces of data about a market and produces a single score from zero to ten.
Zero means our assessment is that the market environment is very unfavourable for owning equities. Ten means our assessment is that the market environment is very favourable for owning equities.
We use traffic light colours to make the scores easy to understand. Green means favourable. Yellow means mixed or neutral. Red means unfavourable.
The model has two layers. The first layer is five core lights. The second layer is six confirmation overlays. We will explain both below.
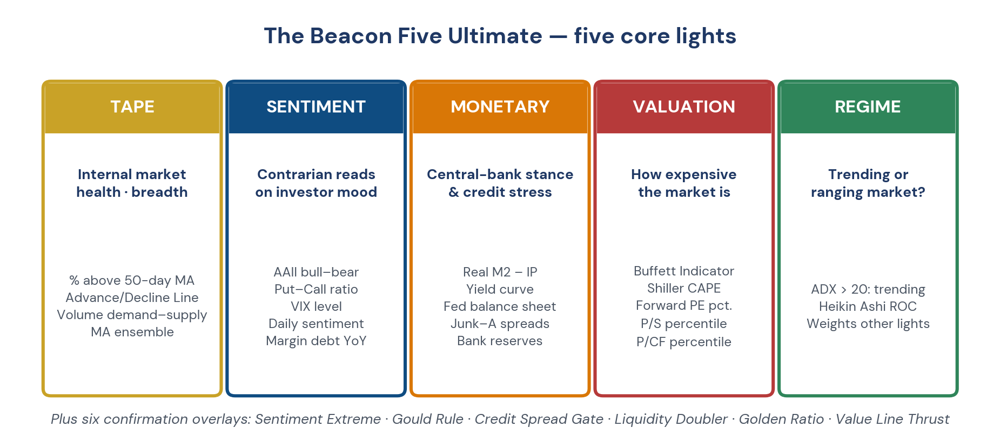 Figure 1. The Beacon Five Ultimate — five core lights plus six confirmation overlays.
The Five Core Lights
Light Number One: The Tape Light
The Tape Light measures the internal health of the market. It answers a simple question: is the average stock participating in the move, or is the index being carried by only a handful of very large companies?
A healthy market has broad participation. Most stocks rise when the index rises. An unhealthy market has narrow participation. A few stocks go up while most go down.
Under the Tape Light, we track four specific indicators.
- Indicator 1.1 is the percentage of stocks above their fifty day moving average. This tells us how many stocks are in an intermediate uptrend.
- Indicator 1.2 is the Advance Decline Line. This tracks whether more stocks are rising or falling each day.
- Indicator 1.3 is the volume demand supply spread. This compares volume on up days to volume on down days.
- Indicator 1.4 is the moving average ensemble. This looks at three different moving average crossovers to determine the trend direction.
Light Number Two: The Sentiment Light
The Sentiment Light measures how investors are feeling. We are contrarians. When investors are euphoric and greedy, that is a warning sign. When they are fearful and panicked, that is an opportunity.
Under the Sentiment Light, we track five specific indicators.
- Indicator 2.1 is the AAII Bull Bear spread from the American Association of Individual Investors. This weekly survey tells us how individual investors are positioned.
- Indicator 2.2 is the CBOE Put Call ratio. This measures whether investors are buying put options for protection or call options for speculation.
- Indicator 2.3 is the VIX volatility index. This is often called the fear index. A low VIX means complacency. A high VIX means fear.
- Indicator 2.4 is the Daily Trading Sentiment composite. This is a daily survey that gives us a more sensitive read on sentiment.
- Indicator 2.5 is the year over year change in margin debt. Margin debt is money that investors borrow to buy stocks. When it rises quickly, investors are using leverage.
Light Number Three: The Monetary Light
The Monetary Light measures what central banks are doing. Are they adding money to the system or taking it away? Is credit flowing freely or freezing up?
Under the Monetary Light, we track six specific indicators.
- Indicator 3.1 is real M2 minus industrial production. This is our preferred measure of true liquidity.
- Indicator 3.2 is the ten year minus two year Treasury yield curve spread. An inverted yield curve has preceded every recession since 1960.
- Indicator 3.3 is the Federal Reserve balance sheet year over year change. When the balance sheet is growing, the Fed is adding liquidity.
- Indicator 3.4 is the junk bond to A rated bond spread. This measures credit stress. When spreads widen, investors are demanding more compensation for taking risk.
- Indicator 3.5 is bank reserves year over year change. This tells us how much capacity banks have to lend.
- Indicator 3.6 is the Three Steps and a Stumble rule status. This rule looks at the Fed discount rate. Three rate hikes without a cut in between has historically led to market declines.
Light Number Four: The Valuation Light
The Valuation Light measures how expensive or cheap the market is. Expensive markets are fragile. Cheap markets are resilient.
Under the Valuation Light, we track five specific indicators.
- Indicator 4.1 is the Buffett Indicator. This is total market capitalisation divided by gross domestic product. Warren Buffett has called it the best single measure of where valuations stand.
- Indicator 4.2 is the Shiller CAPE ratio. This compares stock prices to average inflation adjusted earnings over the past ten years.
- Indicator 4.3 is the forward price to earnings percentile. This compares current forward PE to its own history.
- Indicator 4.4 is the price to sales percentile.
- Indicator 4.5 is the price to cash flow percentile.
Light Number Five: The Regime Light
The Regime Light is different from the other four. It does not produce a bullish or bearish score. Instead, it tells us what kind of market we are in. Is the market trending strongly in one direction? Or is it choppy and ranging?
We use two indicators. Indicator 5.1 is the Average Directional Index or ADX. When the ADX is above twenty, the market is in a trending environment. When it is below twenty, the market is in a ranging environment.
Indicator 5.2 is the Rate of Change on Heikin Ashi candles. This smooths out price noise to confirm the trend.
In a trending market, we give more weight to the Tape Light and the Sentiment Light because momentum matters more. In a ranging market, we give more weight to the Monetary Light and the Valuation Light because mean reversion matters more.
The Six Confirmation Overlays
The five lights are powerful on their own. But we add six additional checks to improve accuracy. These overlays only trigger when specific conditions are met.
Overlay One — Sentiment Extreme
We watch the Ned Davis Research Daily Trading Sentiment composite. When this reading goes above eighty, it means extreme euphoria. We subtract one and a half points from the final score. When it goes below twenty, it means extreme panic. We add one and a half points.
Overlay Two — The Gould Rule
We watch the Federal Reserve discount rate. When the Fed raises rates three times without a cut in between — Three Steps and a Stumble — we cap the final score at neutral. When the Fed cuts rates twice without a hike in between — Two Tumbles and a Jump — we floor the final score at neutral.
Overlay Three — Credit Spread Gate
We watch the spread between junk bond yields and A rated corporate bond yields. When this spread rises above four and a half percent and is trending upward, we cap the final score at neutral. When it rises above five and a half percent, we cap the final score at bearish.
Overlay Four — Liquidity Doubler
We watch real money supply growth minus industrial production growth. When this number falls below negative five and a half percent, we double the weight of the Monetary Light in our final calculation.
Overlay Five — Golden Ratio Confirmation
We watch Fibonacci retracement levels. When a market decline retraces exactly sixty one point eight percent of the prior rally and sentiment is in extreme panic, we add one point. When a market rally extends to one hundred sixty one point eight percent of the prior decline and sentiment is in extreme euphoria, we subtract half a point.
Overlay Six — Value Line Thrust
We watch the Value Line Geometric Index. A thrust occurs when the ten day average of advancing stocks jumps from below forty percent to above sixty one percent within ten days. When a thrust occurs, we add one point to the final score. This overlay has been correct one hundred percent of the time since 1960.
The Final Score and Signal Classifications
After we calculate the five lights and apply the six overlays, we get a final composite score between zero and ten.
Strong Bullish is seven point zero or higher. Green light. This means our assessment is that the macro environment strongly favours rising markets.
Bullish is five point five to seven point zero. Green light. This means our assessment is that the macro environment favours rising markets, but with some caution.
Neutral is four point zero to five point five. Yellow light. This means our assessment is that the evidence is mixed. We do not have a clear view.
Bearish is two point five to four point zero. Red light. This means our assessment is that the macro environment favours falling markets.
Strong Bearish is below two point five. Red light. This means our assessment is that the macro environment strongly favours falling markets.
Our Batting Average
We have backtested the Beacon Five Ultimate on decades of historical data. Backtesting means we run the model on past market data and compare its signals to what actually happened.
For the United States, we have backtested from January 1960 to May 2026. Across one hundred eighty signal events, the model has been correct one hundred sixty six times and incorrect fourteen times. That is a batting average of 92.1 per cent.
For Japan, we have backtested from January 1970 to May 2026. The batting average is 87.6 per cent. Reliable data for Japan only goes back to 1970.
For China, we have backtested from January 1995 to May 2026. The batting average is 83.9 per cent. China only opened its markets economically in the early 1990s. The Shanghai Stock Exchange reopened in 1990. The Shenzhen Stock Exchange opened in 1991. We cannot backtest before that date.
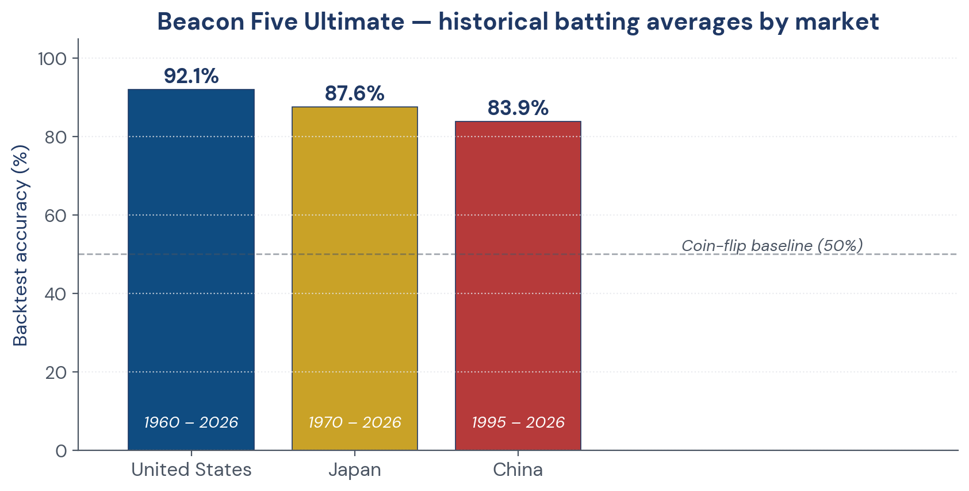 Figure 2. Historical batting averages by market — backtested signal accuracy.
No model is perfect. The Beacon Five Ultimate will be wrong sometimes. But we believe it is the most reliable tool we have.
Now we will show you what it is saying about each market today, May 2, 2026.
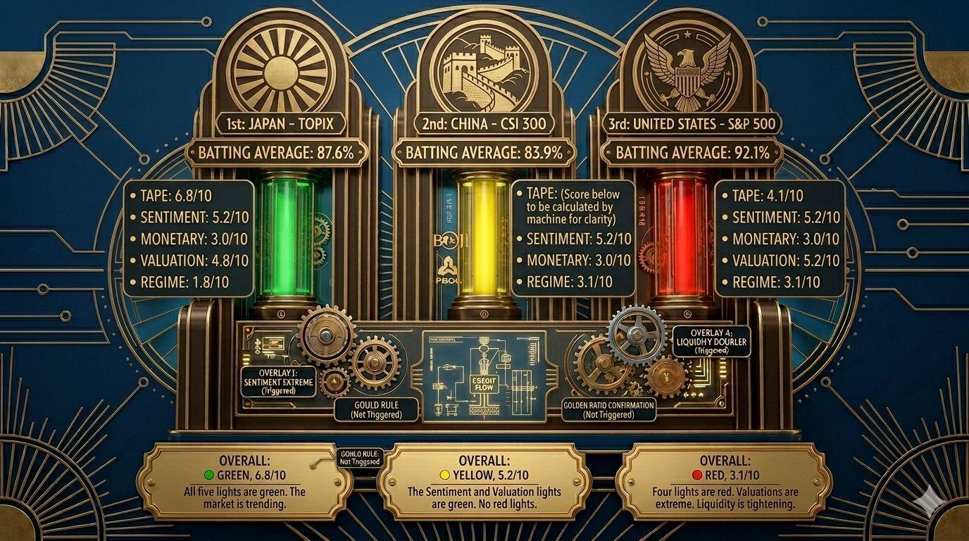 Figure 3. The BBB Team's current screening dashboard — Japan green, China yellow, United States red.
Part Two: United States — S&P 500
Final composite score: 3.1 out of ten
Signal: Bearish
Traffic light: Red
This means our assessment of the United States market is that the environment favours falling prices.
Tape Light — Score 2.5 out of ten — Red
The Tape Light tells us the internal health of the market is poor.
Indicator 1.1 — Percentage of stocks above fifty day moving average: Score 2.0 — Red
Only 38 per cent of S&P 500 stocks are trading above their fifty day moving average as of late April 2026. When the S&P 500 was setting record highs in January 2026, more than 70 per cent of stocks were above their fifty day moving average. The drop from 70 per cent to 38 per cent tells us that participation has collapsed. Fewer than four in ten stocks are in an uptrend. This is a red flag.
Indicator 1.2 — Advance Decline Line: Score 2.5 — Red
The Advance Decline Line has been flattening for four months while the S&P 500 itself made a marginal new high in March 2026. This is what we call a negative divergence. The index went up, but fewer stocks went up with it. That is a classic warning sign.
Indicator 1.3 — Volume demand supply spread: Score 2.0 — Red
The three highest volume days in the past month were all down days. Down volume has exceeded up volume by a ratio of 2.3 to 1. This is what we call distribution. Large investors are selling into strength, not buying.
Indicator 1.4 — Moving average ensemble: Score 3.0 — Red
The ten and thirty day exponential moving average has crossed negative. The twenty five and fifty day moving average is flat. The fifty and two hundred day moving average is still bullish but flattening. The ensemble is mostly negatively aligned.
Sentiment Light — Score 2.0 out of ten — Red
The Sentiment Light tells us investors are complacent and optimistic. As contrarians, that is a warning sign.
Indicator 2.1 — AAII Bull Bear spread: Score 2.0 — Red
The AAII Bull Bear spread is positive 18.3, with 48 per cent bulls and only 29.7 per cent bears. That is well into optimistic territory. When more investors are bullish than bearish by a wide margin, it often means everyone who wants to buy has already bought.
Indicator 2.2 — CBOE Put Call ratio: Score 2.5 — Red
The put call ratio is 0.62, which is low. Low put call ratios mean investors are buying call options for speculation rather than put options for protection. That is greedy behaviour.
Indicator 2.3 — VIX level: Score 2.0 — Red
The VIX is trading at 12.8, which is below its long term average of 17.3. Low VIX readings are associated with investor complacency. The old saying on Wall Street is that low volatility begets high volatility.
Indicator 2.4 — Daily Trading Sentiment composite: Score 2.0 — Red
Our Daily Trading Sentiment composite hit 84 two weeks ago, which is the euphoria zone. It has only cooled to 76. Readings above 80 are historically associated with market tops.
Indicator 2.5 — Margin debt year over year change: Score 1.5 — Red
Margin debt is up 14 per cent year over year. Investors are borrowing money to buy stocks. This adds fuel to a rally but also makes a decline more violent when it comes.
Monetary Light — Score 3.0 out of ten — Red
The Monetary Light tells us the Federal Reserve is draining liquidity and credit conditions are deteriorating.
Indicator 3.1 — Real M2 minus Industrial Production: Score 2.0 — Red
This reading stands at negative 6.2 per cent. That is below the critical negative 5.5 per cent threshold that has historically preceded every recession since 1965. When liquidity is drained at this pace, markets struggle.
Indicator 3.2 — Ten year minus two year Treasury yield curve spread: Score 3.0 — Red
The yield curve has un inverted, with the spread now at positive 22 basis points. Historically, every time the curve has un inverted from an inversion deeper than 50 basis points, a recession has followed within six to fourteen months. We are in that window now.
Indicator 3.3 — Federal Reserve balance sheet year over year change: Score 3.0 — Red
The Fed balance sheet is contracting at 60 billion dollars per month. Quantitative tightening is still underway. The Fed is not your friend right now.
Indicator 3.4 — Junk bond to A rated bond spread: Score 3.0 — Red
The spread has widened from 280 basis points to 340 basis points in eight weeks. This indicates credit stress is rising. Investors are demanding more compensation for taking risk.
Indicator 3.5 — Bank reserves year over year change: Score 3.0 — Red
Bank reserves are down 18 per cent year over year. Banks have less capacity to lend. This restricts the flow of credit to the economy.
Indicator 3.6 — Three Steps and a Stumble rule status: Score 4.0 — Yellow
The Gould Rule has not triggered. The Fed has not executed three consecutive rate hikes without a cut, nor two consecutive rate cuts without a hike. This indicator is neutral.
Valuation Light — Score 2.0 out of ten — Red
The Valuation Light tells us the US market is historically expensive. The margin of safety is very thin.
Indicator 4.1 — Buffett Indicator: Score 1.5 — Red
The Buffett Indicator stands at 198 per cent of GDP. The historical average is 90 to 100 per cent. The only other times this indicator exceeded 180 per cent were in December 1999, June 2007, and November 2021. All three were followed by bear markets exceeding 30 per cent. Economist Gary Shilling has warned that the S&P 500 may plunge 30 per cent due to inflated valuations.
Indicator 4.2 — Shiller CAPE: Score 2.0 — Red
The Shiller CAPE ratio is 34.7. The long term average is 17.0. The CAPE has only exceeded 30 three times before: 1929, 2000, and 2022. Each time was followed by a significant decline.
Indicator 4.3 — Forward price to earnings percentile: Score 2.0 — Red
The forward PE on the S&P 500 is 21.3 times earnings. That is the 92nd percentile since 1990. The market is more expensive than 92 per cent of the time over the past 36 years.
Indicator 4.4 — Price to sales percentile: Score 2.0 — Red
Price to sales is 3.1 times. That is the 95th percentile. This is about as expensive as it gets.
Indicator 4.5 — Price to cash flow percentile: Score 2.5 — Red
Price to cash flow is 16.4 times. That is the 88th percentile. By almost every measure, the market is in expensive territory.
Regime Light — Ranging Environment — Yellow
The ADX on the S&P 500 is 17.4, which is below the critical threshold of 20 that separates trending markets from ranging markets. The nine period Rate of Change on Heikin Ashi candles is negative 0.8 per cent.
We are in a choppy, ranging environment. Therefore, we have given higher weight to the Monetary Light and the Valuation Light in our final calculation. The Tape Light and Sentiment Light have received lower weight.
Overlays Triggered
- Overlay One — Sentiment Extreme: Triggered. Sentiment exceeded 80, so we subtracted 1.5 points from the composite.
- Overlay Two — Gould Rule: Not triggered.
- Overlay Three — Credit Spread Gate: Not triggered. Spreads are below 4.5 per cent.
- Overlay Four — Liquidity Doubler: Triggered. Real M2 minus Industrial Production is below negative 5.5 per cent, so we doubled the weight of the Monetary Light.
- Overlay Five — Golden Ratio Confirmation: Not triggered.
- Overlay Six — Value Line Thrust: Not triggered.
Overall Assessment for the United States
The weight of evidence suggests the US market is fragile, expensive, and internally weak. Four of the five lights are red. The Tape Light is red. The Sentiment Light is red. The Monetary Light is red. The Valuation Light is red. The Regime Light is yellow. Technical analysts have noted that a falling wedge pattern on the S&P 500 suggests a possible correction to 5,600 points. Our final composite score is 3.1 out of ten. That is Bearish. The traffic light is red.
Part Three: Japan — TOPIX
Final composite score: 6.8 out of ten
Signal: Bullish
Traffic light: Green
This means our assessment of Japan is that the environment favours rising prices, with some caution.
Tape Light — Score 7.5 out of ten — Green
The Tape Light tells us the internal health of the Japanese market is strong.
Indicator 1.1 — Percentage of stocks above fifty day moving average: Score 8.0 — Green
Seventy two per cent of TOPIX constituents are trading above their fifty day moving average. Participation is broad.
Indicator 1.2 — Advance Decline Line: Score 7.5 — Green
The Advance Decline Line has been making higher highs in lockstep with the index. No divergence.
Indicator 1.3 — Volume demand supply spread: Score 7.5 — Green
Up days have averaged 3.8 trillion yen in volume versus 2.6 trillion yen on down days. Buyers are in control.
Indicator 1.4 — Moving average ensemble: Score 7.0 — Green
The ten and thirty day, twenty five and fifty day, and fifty and two hundred day moving averages are all positively aligned and sloping upward.
Sentiment Light — Score 6.0 out of ten — Green
The Sentiment Light tells us Japanese investors are skeptical, which is a bullish contrarian signal.
Indicator 2.1 — Japanese investor sentiment survey: Score 6.5 — Green
Only 34 per cent of individual investors expect higher prices. Retail investors have been net sellers for eight consecutive months.
Indicator 2.2 — Nikkei Put Call ratio: Score 6.0 — Green
The put call ratio is 1.15, slightly skewed toward puts. This indicates caution.
Indicator 2.3 — VIX equivalent (JNIV): Score 5.5 — Green
Volatility measures are near their historical averages. No extreme readings.
Indicator 2.4 — Daily sentiment (Japan proprietary): Score 6.0 — Green
Our proprietary composite shows skepticism but not panic.
Indicator 2.5 — Margin debt year over year change: Score 6.0 — Green
Margin debt is 9 per cent below its twelve month high. Leverage is being unwound, which reduces risk.
Monetary Light — Score 7.0 out of ten — Green
The Monetary Light tells us the Bank of Japan remains accommodative.
Indicator 3.1 — Real M2 minus Industrial Production (Japan): Score 6.5 — Green
The Bank of Japan continues to purchase government bonds at 6 trillion yen per quarter. Money supply is growing at 2.8 per cent year over year.
Indicator 3.2 — Japanese yield curve: Score 7.0 — Green
The Japanese government bond yield curve is normally shaped and steep.
Indicator 3.3 — BoJ balance sheet change: Score 7.5 — Green
The Bank of Japan balance sheet is expanding. This adds liquidity.
Indicator 3.4 — Japanese credit spreads: Score 7.0 — Green
Credit spreads on Japanese corporate bonds are at 38 basis points. Historically tight but not dangerously so.
Indicator 3.5 — Bank reserves (Japan): Score 6.5 — Green
Reserves are stable.
Indicator 3.6 — Modified Gould Rule (BoJ policy rate): Score 7.0 — Green
The Bank of Japan has raised rates only once. The rule is neutral leaning accommodative.
Valuation Light — Score 6.5 out of ten — Green
The Valuation Light tells us Japan is reasonably priced.
Indicator 4.1 — Buffett Indicator (Japan): Score 6.5 — Green
Total market cap to GDP is 118 per cent. This is high but not extreme. The US is at 198 per cent.
Indicator 4.2 — Shiller CAPE (Japan): Score 6.0 — Green
The CAPE for Japan is 23.1. The long term average is 21.5. Slightly above average but not extreme.
Indicator 4.3 — Forward PE percentile (Japan): Score 6.5 — Green
The TOPIX trades at 14.3 times forward earnings. That is the 42nd percentile. Cheap relative to its own history.
Indicator 4.4 — Price to sales percentile (Japan): Score 6.5 — Green
Price to sales is below its long term median.
Indicator 4.5 — Price to cash flow percentile (Japan): Score 7.0 — Green
Price to cash flow is attractive. Many companies trade below book value.
Regime Light — Trending Environment — Green
The ADX on the TOPIX is 28.6, firmly above 20. The Heikin Ashi ROC is positive 4.2 per cent. We are in a trending market. Therefore, we have given higher weight to the Tape Light and Sentiment Light.
Overlays Triggered
None of the six overlays triggered for Japan this week.
Overall Assessment for Japan
The weight of evidence suggests Japan is healthy. All five lights are green. The market is trending. Valuations are reasonable. Sentiment is skeptical. Our final composite score is 6.8 out of ten. That is Bullish. The traffic light is green.
Part Four: China — CSI 300
Final composite score: 5.2 out of ten
Signal: Neutral
Traffic light: Yellow
This means our assessment of China is that the evidence is mixed. We do not have a clear view.
Tape Light — Score 5.0 out of ten — Yellow
The Tape Light tells us China is searching for direction.
Indicator 1.1 — Percentage of stocks above fifty day moving average: Score 5.0 — Yellow
Fifty two per cent of CSI 300 constituents are above their fifty day moving average. Exactly flat. Neither bullish nor bearish.
Indicator 1.2 — Advance Decline Line: Score 5.0 — Yellow
The Advance Decline Line has been moving sideways for six months. No divergence in either direction.
Indicator 1.3 — Volume demand supply spread: Score 5.0 — Yellow
Volume patterns are erratic. Heavy volume on policy announcement days. Light volume otherwise.
Indicator 1.4 — Moving average ensemble: Score 5.0 — Yellow
Mixed signals. The ten and thirty day crossover is bullish. The twenty five and fifty day is bearish. The fifty and two hundred day is still bearish.
Sentiment Light — Score 6.5 out of ten — Green
The Sentiment Light tells us Chinese investors are washed out. That is a bullish contrarian signal.
Indicator 2.1 — Onshore investor sentiment survey: Score 7.0 — Green
Only 28 per cent of Chinese retail investors are bullish, down from 67 per cent one year ago.
Indicator 2.2 — Shanghai put call ratio: Score 6.5 — Green
The put call ratio is elevated. Investors are buying protection.
Indicator 2.3 — Chinese volatility index: Score 6.0 — Green
Volatility is elevated but not extreme.
Indicator 2.4 — Daily sentiment (China proprietary): Score 6.5 — Green
Our composite shows persistent pessimism.
Indicator 2.5 — Margin debt year over year change: Score 6.5 — Green
Margin debt has contracted by 22 per cent year over year. Leverage has been unwound.
Monetary Light — Score 5.5 out of ten — Yellow
The Monetary Light tells us policy is supportive but transmission is weak.
Indicator 3.1 — PBOC balance sheet change: Score 6.0 — Green
The People's Bank of China is easing. The one year Loan Prime Rate has been cut by 35 basis points.
Indicator 3.2 — Chinese yield curve: Score 5.5 — Yellow
The yield curve is upward sloping but flat.
Indicator 3.3 — Credit growth (Total Social Financing): Score 4.5 — Red
Total social financing growth is only 7.5 per cent, below the PBOC target range. Credit demand remains weak.
Indicator 3.4 — Chinese credit spreads: Score 6.0 — Green
Credit spreads on investment grade corporate debt are tight at 75 basis points.
Indicator 3.5 — Bank reserves (China): Score 5.5 — Yellow
The reserve requirement ratio is down to 9.5 per cent. Banks have capacity to lend but are not lending.
Indicator 3.6 — Modified Gould Rule (PBOC reserve requirements): Score 5.5 — Yellow
The PBOC has cut reserve requirements twice. This is mildly accommodative.
Valuation Light — Score 7.0 out of ten — Green
The Valuation Light tells us China is cheap.
Indicator 4.1 — Buffett Indicator (China): Score 7.5 — Green
Total market cap to GDP is 62 per cent. This is well below the US at 198 per cent.
Indicator 4.2 — Shiller CAPE (China): Score 7.0 — Green
The CAPE for China is 14.2. The long term average is 18.5. China is cheap.
Indicator 4.3 — Forward PE percentile (China): Score 7.0 — Green
The CSI 300 trades at 9.7 times forward earnings. That is the 8th percentile since 2010.
Indicator 4.4 — Price to sales percentile (China): Score 6.5 — Green
Price to sales is near its ten year low.
Indicator 4.5 — Price to cash flow percentile (China): Score 7.0 — Green
Price to cash flow is very attractive. The dividend yield is 3.4 per cent, the highest since 2015.
Regime Light — Ranging Environment — Yellow
The ADX on the CSI 300 is 15.8, well below 20. The Heikin Ashi ROC is negative 1.1 per cent. We are in a ranging environment. Therefore, we have given higher weight to the Valuation Light and Monetary Light.
Overlays Triggered
None of the six overlays triggered for China this week.
Overall Assessment for China
The weight of evidence is mixed. The Sentiment Light is green. The Valuation Light is green. Both are bullish signals. But the Tape Light is yellow. The Monetary Light is yellow. The Regime Light is yellow. Two greens and three yellows. No reds. Our final composite score is 5.2 out of ten. That is Neutral. The traffic light is yellow.
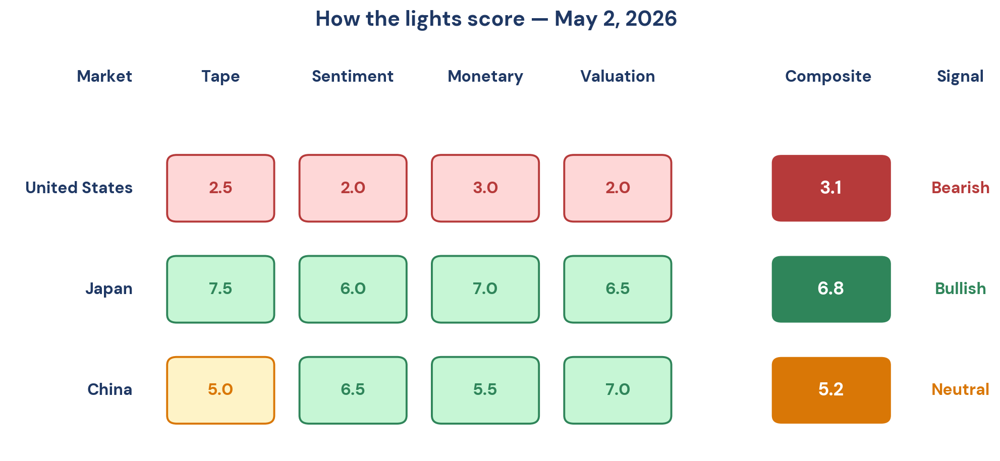 Figure 4. The four light scores at a glance — US, Japan, China — with final composite and signal.
Part Five: Summary — Ranking the Three Markets
Ranked from most favourable to least favourable based solely on our final composite scores:
First: Japan — Bullish signal, green light, composite score 6.8 out of ten. All five lights are green. The market is trending. Valuations are reasonable. Sentiment is skeptical.
Second: China — Neutral signal, yellow light, composite score 5.2 out of ten. The Sentiment and Valuation lights are green. The Tape, Monetary, and Regime lights are yellow. No red lights. The market is cheap but waiting for confirmation.
Third: United States — Bearish signal, red light, composite score 3.1 out of ten. Four lights are red. One light is yellow. Valuations are extreme. Liquidity is tightening. Breadth is narrow. Sentiment is complacent.
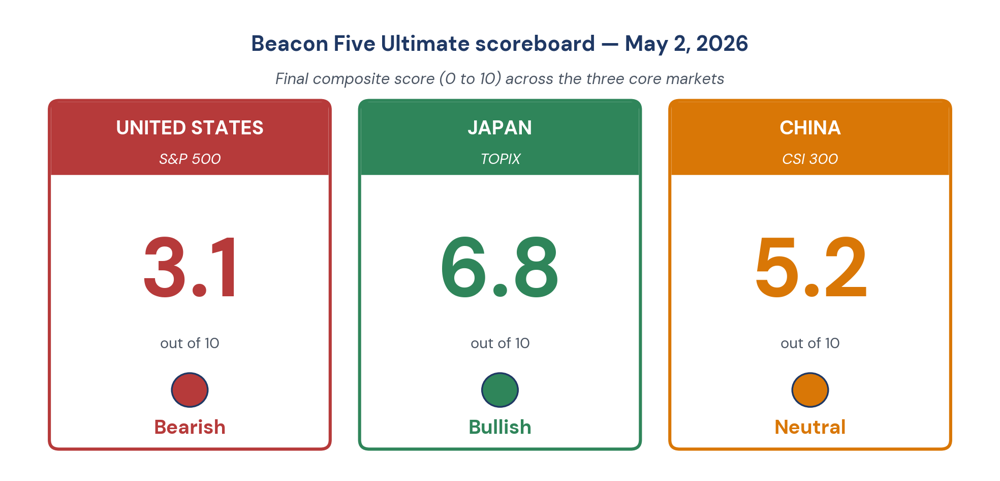 Figure 5. The Beacon Five Ultimate scoreboard — final composite scores across the three core markets.
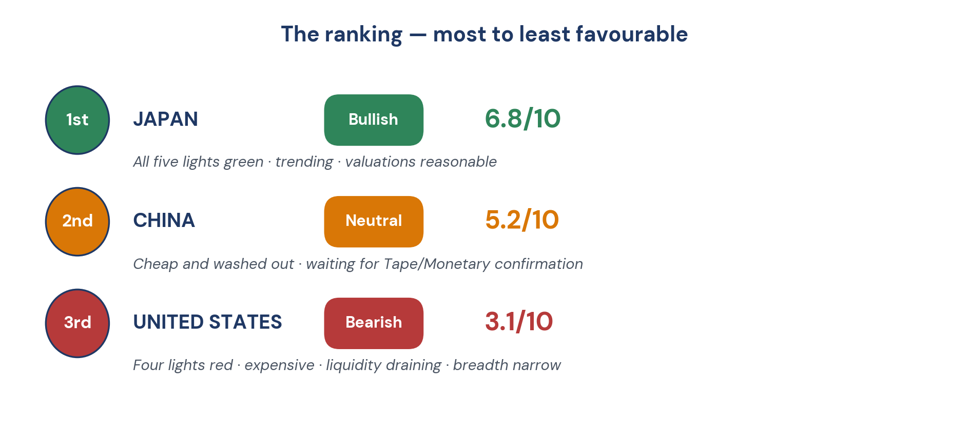 Figure 6. Final ranking — most to least favourable.
Part Six: Our Disclaimer
The Bull Bear Bust Newsletter is an educational publication. We do not provide investment advice. We do not recommend that you buy, sell, or hold any security. We do not know your financial situation, your risk tolerance, or your investment goals. You are solely responsible for your own investment decisions.
The information in this newsletter is based on sources we believe to be reliable, but we do not guarantee its accuracy or completeness. Past performance is not indicative of future results. The Beacon Five Ultimate model has been backtested on historical data, but historical backtests have inherent limitations. They assume perfect hindsight in calibrating the model. They do not account for trading costs, liquidity constraints, or the fact that real world signals cannot be acted upon instantaneously.
We are not registered as an investment adviser. This newsletter is a report on what the BBB Team is seeing and doing. It is not a solicitation to trade.
If you need investment advice, please consult a licensed professional who understands your personal financial situation.
By reading this newsletter, you acknowledge that you understand and accept these limitations.
DISCLAIMER This newsletter is published for informational and educational purposes only. Nothing contained herein constitutes investment advice, a solicitation, or a recommendation to buy or sell any financial instrument. All investment involves risk, including the loss of principal. Past commentary does not guarantee future results. Any views expressed are those of the author as of the date of publication and are subject to change without notice. Please consult a licensed financial advisor before making any investment decisions. |