Macro Analysis United States
The Complete Roadmap
How We Navigate the S&P 500 Through the Coming Storm and Into the Next Recovery
Bull, Bear, Bust · 5 July 2026 · 15 min read
If there is one thing decades of watching markets have taught us, it is this: the stock market is not a mystery to be solved, but a cycle to be understood. It moves in waves — not random, not perfectly predictable, but patterned enough that a disciplined observer can tilt the odds in their favor.
KEY POINTS
▸ We are in a late-stage bull market with extreme valuations, complacent sentiment, and narrowing breadth. The conditions for a significant correction are in place. ▸ We expect the S&P 500 to make one final high between 7,000 and 7,500 before rolling over. ▸ A correction of 15–20% is highly probable, with a target range of 5,900–6,100. ▸ The capitulation low — the best buying opportunity in years — will likely occur in late 2026, with a potential overshoot to 5,600–5,800. ▸ The subsequent recovery should carry the S&P 500 to new highs of 7,200–8,000 by late 2027. ▸ We are positioning now by raising cash, tightening stops, and preparing our buy list. We will act decisively at the point of maximum pessimism. ▸ We will not be ruled by emotion. We have a process. We trust it. We execute it. A quick-read snapshot of this newsletter's investment case |
This month, we are pulling back the curtain on our complete investment strategy for the United States equity market. We are writing this in plain English because complexity is often the enemy of clarity. What follows is the roadmap we are using right now to position our wholesale fund for the next twelve to eighteen months. It is built on the work of Ned Davis Research, the CANSLIM growth discipline, rigorous technical analysis, and a healthy respect for the emotional rollercoaster that is human investing.
We will tell you where we think the S&P 500 is heading, why a significant correction appears highly probable, and exactly how we plan to profit from the panic when it arrives — and then from the recovery that always, eventually, follows.
The Core Belief — Markets Are Driven by Four Engines
Before we talk about charts or price targets, we need to agree on what moves markets. In our experience, there are only four engines.
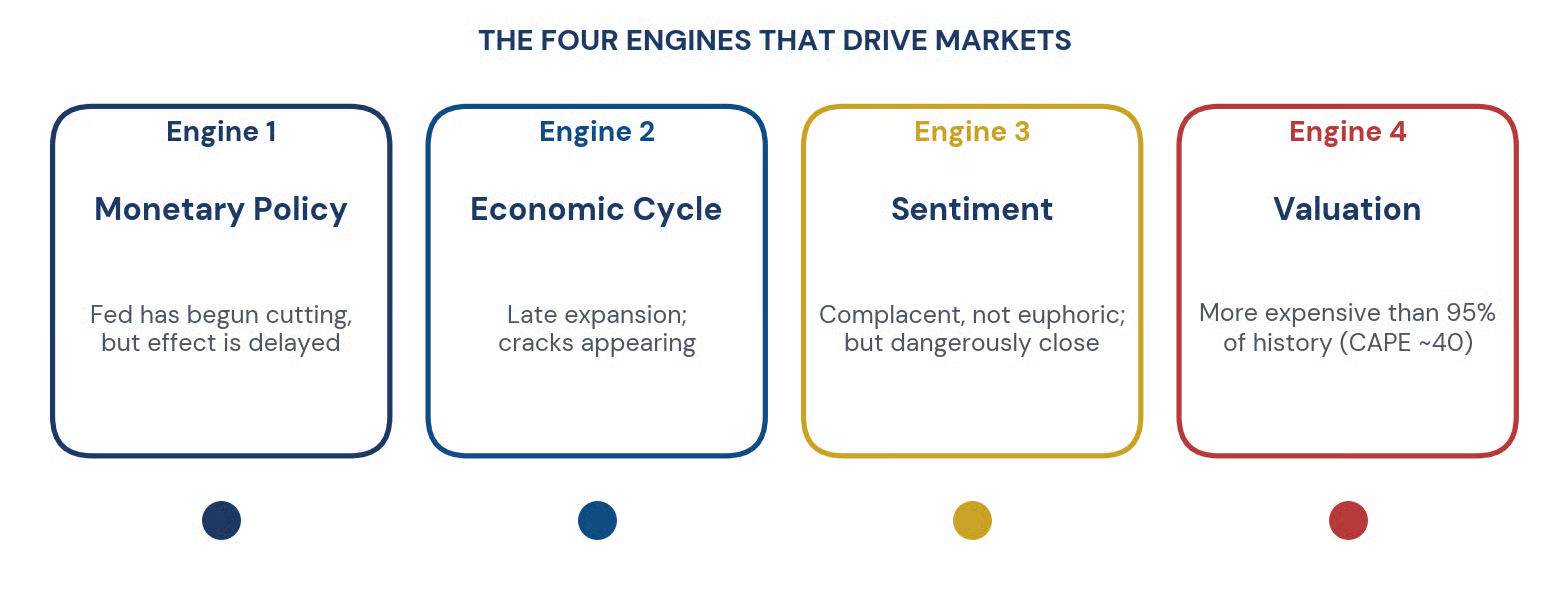 Figure 1. The four engines that drive equity markets.
The first engine is monetary policy. When the Federal Reserve is cutting interest rates or printing money, liquidity floods the system and stocks tend to rise. When the Fed is raising rates and pulling money out, stocks struggle. Right now, the Fed has begun cutting, which is supportive, but the effect takes months to fully arrive. We are in the waiting room, not yet in the operating theatre.
The second engine is the economic cycle. Are businesses expanding? Are people employed? Are wages growing? The economy is currently in a late‑expansion phase. Growth is still positive, but it is slowing. This is not yet a recession, but the cracks are appearing. Think of it as an engine that is still running but making a few unfamiliar noises.
The third engine is sentiment — the collective mood of investors. When everyone is euphoric and fully invested, there is no one left to buy. That is when markets top. When everyone is despondent and selling in panic, that is when markets bottom. Right now, sentiment is complacent. Not euphoric, but dangerously close. The crowd is not worried. That worries us.
The fourth engine is valuation. This is the simple question of price versus worth. By almost any measure — the Shiller P/E ratio, the Buffett Indicator, price to sales — the American stock market is more expensive today than it has been for ninety‑five percent of its history. Only the late 1920s and the dot‑com bubble of 2000 were pricier. Valuations do not tell you when a crash will happen, but they tell you that the air is thin and the fall, when it comes, could be painful.
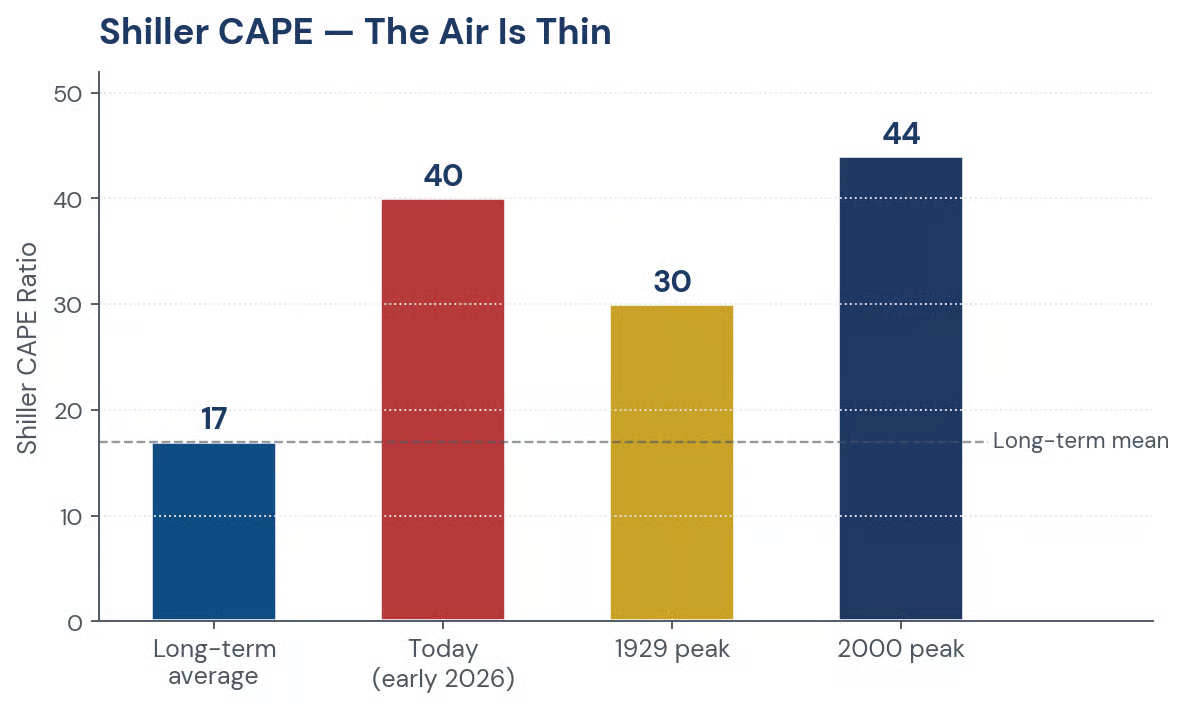 Figure 2. Shiller CAPE — today’s reading sits among the most extreme on record.
Our entire strategy is built on watching these four engines and adjusting our sails accordingly. No single indicator rules. We look for the weight of the evidence.
Valuations do not tell you when a crash will happen, but they tell you that the air is thin and the fall, when it comes, could be painful.
Where We Are Right Now — The Late Stage of a Great Bull Market
Let us be direct. The bull market that began in October 2022 has been extraordinary. The S&P 500 has nearly doubled. A handful of technology giants have carried the entire index on their shoulders. But this is precisely what late‑stage bull markets look like. Breadth narrows. Fewer and fewer stocks participate in the rally. The advance becomes fragile.
Our technical indicators are flashing amber. The percentage of stocks trading above their two‑hundred‑day moving average has been falling for months, even as the S&P 500 made new highs. This is a divergence. It is like a car whose speedometer is rising but whose engine is sputtering. Eventually, the two must reconcile.
We are also watching the relationship between the twenty‑three day and the fifty‑five day exponential moving averages. When the shorter average crosses above the longer one, we call it a Golden Cross. It is a green light. That happened over a year ago. But when the shorter crosses back below the longer — a Death Cross — it is a red light. We are not there yet, but we are close. The gap is narrowing.
Valuations, as we said, are extreme. The Shiller CAPE ratio, which averages inflation‑adjusted earnings over ten years, stands near forty. The only other times it has been this high were just before the 1929 crash and just before the 2000 dot‑com collapse. That does not mean a crash is coming tomorrow. It does mean that expected returns over the next decade are likely to be low, and that any shock could trigger a violent revaluation.
Sentiment surveys from the American Association of Individual Investors show that bullishness is still elevated. Meanwhile, the put/call ratio — a measure of how many traders are buying insurance against a decline — is very low. Low demand for insurance tells us that no one is worried. That is exactly when markets become most vulnerable.
So where does that leave us? We believe the S&P 500 has one final leg higher. Call it a melt‑up, a blow‑off top, a final gasp. We expect the index to trade into the range of seven thousand to seven thousand five hundred points. That is roughly five to twelve percent above current levels. This final ascent will be narrow, driven by the same few mega‑cap names, and it will be accompanied by declining volume. That is the signature of exhaustion.
After that, the correction begins.
The Correction — Why Fifteen to Twenty Percent Is the Most Likely Outcome
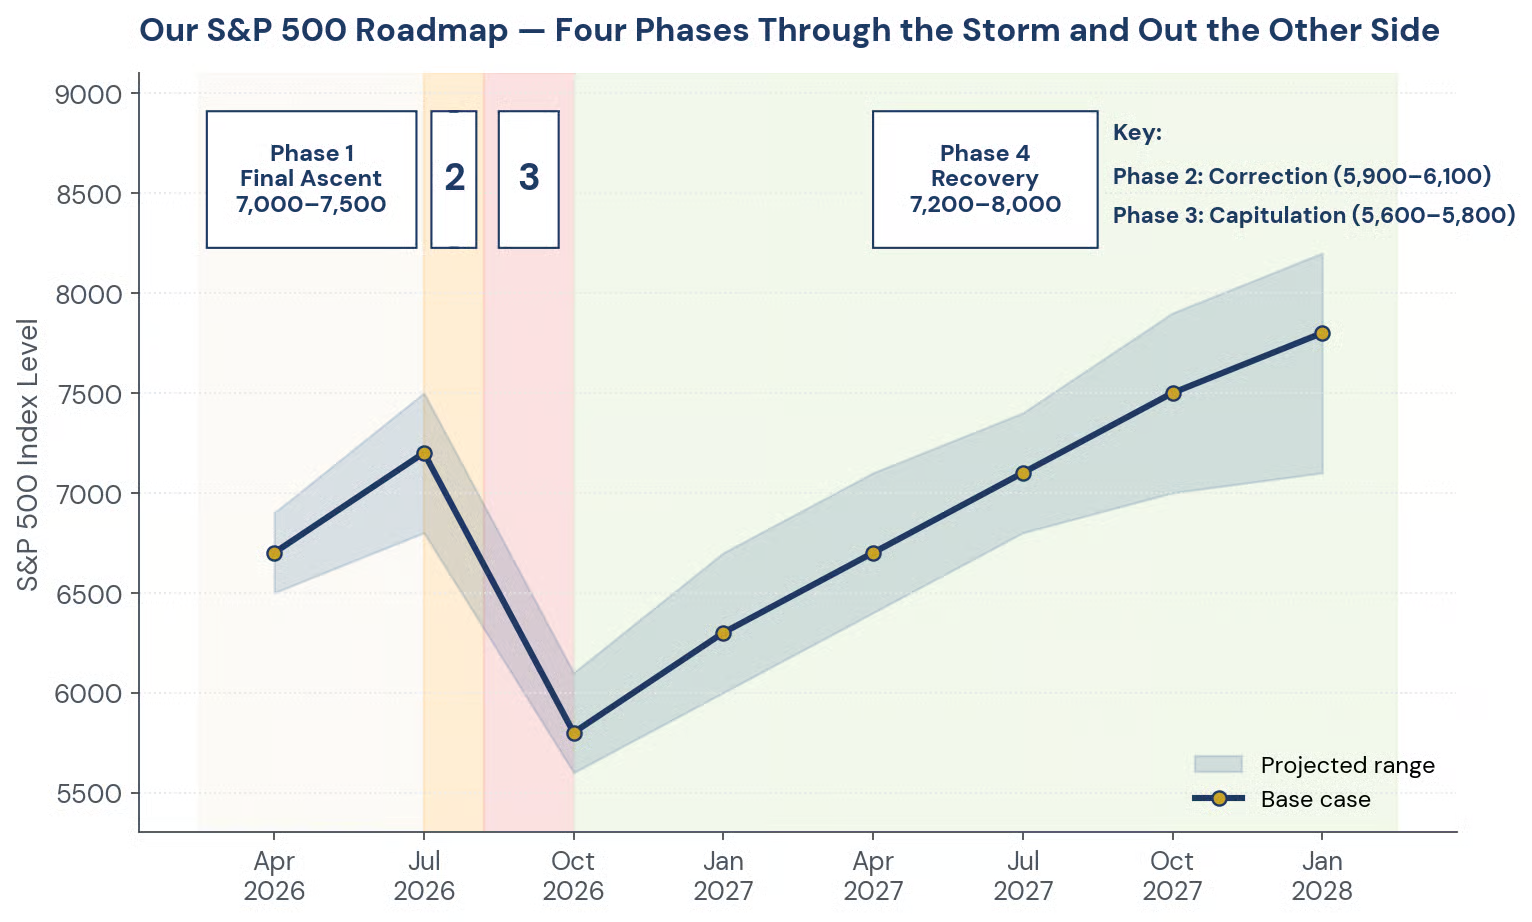 Figure 3. Four-phase roadmap — final ascent, correction, capitulation, recovery.
Let us talk about the word correction. A correction is a decline of ten to nineteen percent from a recent peak. A bear market is twenty percent or more. A crash is thirty percent or more. We assign probabilities to each.
A correction of fifteen to twenty percent is, in our view, highly probable. We put the odds at eighty‑five percent. This is not a wild guess. It is based on history, on technical patterns, and on the unavoidable mathematics of valuation.
Consider the political cycle. Midterm election years — and 2026 is a midterm year — are historically the weakest period of the four‑year presidential cycle. The average intra‑year drawdown during a midterm year is around nineteen percent. When a new president is in office, that number rises to twenty‑one percent. We are right on schedule.
Consider the technical setup. We are watching for a Death Cross of the twenty‑three and fifty‑five day moving averages. When that happens — and we expect it to happen in the middle of 2026 — it will be a clear signal to reduce risk. We also expect the S&P 500 to break below its two‑hundred‑day moving average, which is widely watched by institutional investors. Once that line is breached, algorithmic selling tends to accelerate.
Consider the sentiment pendulum. Today, complacency reigns. The VIX index, often called the fear gauge, is low. Put/call ratios are low. Margin debt is elevated. When the turn comes, it will be swift. Fear feeds on itself. Stop‑losses trigger, which leads to more selling, which triggers more stop‑losses. This is not a gentle decline. It is a cascade.
Our target for the low of this correction is the range of five thousand nine hundred to six thousand one hundred on the S&P 500. That represents a fifteen to twenty percent drop from the peak we expect in the mid‑sevens. This is not a crash. It is a healthy, painful, necessary cleansing of excess. But make no mistake: it will feel like a crash if you are not prepared.
The Capitulation Low — The Moment When Panic Meets Opportunity
Every significant market decline ends the same way: with a capitulation. Capitulation is not a technical term. It is a human one. It is the moment when the last seller throws in the towel, when hope is extinguished, when the nightly news is filled with words like crisis and collapse. It is also, paradoxically, the single best time to buy in years.
How do we recognize capitulation? We look for three things.
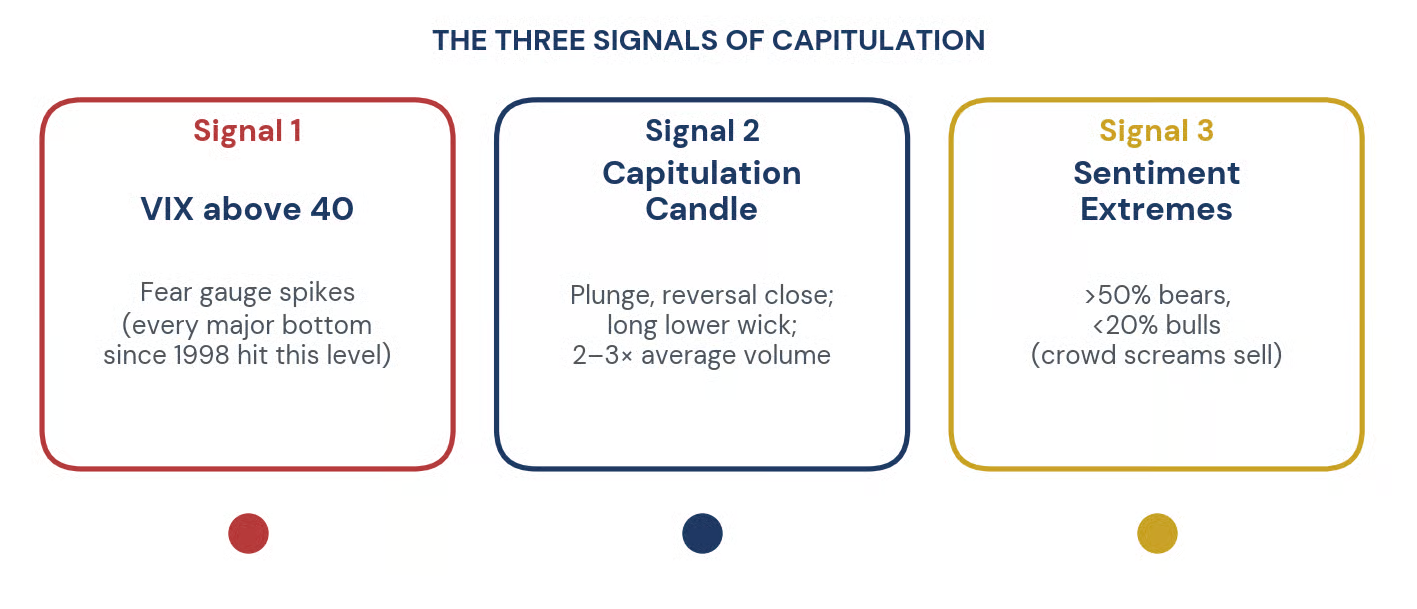 Figure 4. The three signals of capitulation — our buy trigger.
First, a spike in the VIX above forty. The VIX normally trades between fifteen and twenty. When it jumps to forty or higher, it signals that fear has reached a fever pitch. This has happened during every major bottom of the past thirty years — 1998, 2002, 2008, 2011, 2020, and 2022.
Second, a capitulation candle on the daily chart. This is a day when the market opens lower, plunges to new lows, and then reverses sharply to close near its high. The candle has a long lower wick, like a hammer. It tells us that sellers exhausted themselves and buyers finally stepped in. Volume on that day is almost always two or three times the average.
Third, extreme readings in sentiment surveys. When the percentage of bearish investors exceeds fifty percent and the percentage of bullish investors falls below twenty percent, the crowd is screaming sell. That is our signal to buy.
We expect this capitulation low to occur in the late third quarter of 2026. Our price target is five thousand six hundred to five thousand eight hundred on the S&P 500. That would represent a twenty‑two to twenty‑five percent decline from the peak. It would officially be a bear market. And it would be, in our view, the opportunity of the decade.
At that moment, our fund will do what most investors cannot: we will buy aggressively. We will deploy at least half of our cash reserves within five days of that capitulation candle. We will focus on the highest‑quality growth stocks — companies with strong earnings, dominant market positions, and clean balance sheets — that have been swept down with the tide. These are the stocks that lead the next recovery.
The Recovery — New Highs by Late 2027
History is our guide here. The twelve months following a midterm election low are, on average, the strongest of the entire four‑year cycle. The average gain from the October low to the following October is approximately fourteen percent. But when the low is accompanied by a bear market — as we expect this one to be — the subsequent recovery is often much larger.
We anticipate that the S&P 500 will bottom, reverse sharply, and then grind steadily higher through 2027. By the end of next year, we expect the index to be trading between seven thousand two hundred and eight thousand points. That would represent a twenty‑five to forty percent recovery from the capitulation low.
What drives this recovery? Three things.
First, the Federal Reserve will likely be in full easing mode by then. Rate cuts take time to work through the economy, but by late 2026 and into 2027, their effect will be visible. Lower rates reduce borrowing costs, boost corporate profits, and make stocks more attractive relative to bonds.
Second, the artificial intelligence investment cycle is real. We are still in the early innings of a productivity revolution. The companies that provide the infrastructure — chips, cloud computing, data centres — will continue to grow regardless of the broader economic cycle. A correction will shake out the speculators, but the fundamental leaders will emerge stronger.
Third, and most importantly, human nature does not change. After a crash, investors are terrified. They sit in cash. They miss the first twenty percent of the rally. Then they watch their neighbours get rich. Eventually, fear turns to greed, and greed turns to euphoria, and the cycle begins again. Our job is to be early, not perfect. We will buy at the point of maximum pessimism and hold through the recovery.
Our Tactical Playbook — What We Do in Each Phase
Let us make this practical. Here is exactly what our fund does in each phase of the cycle.
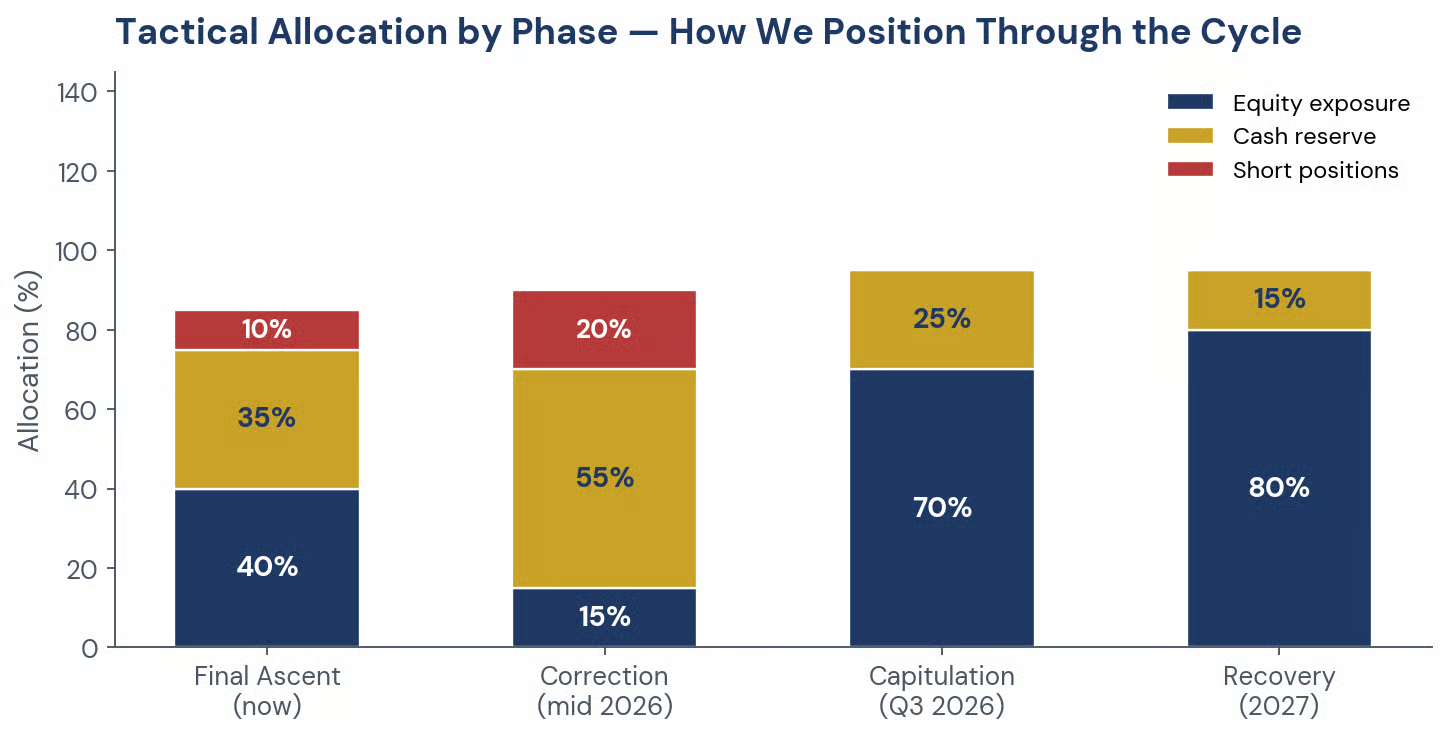 Figure 5. Tactical allocation across the four phases of the cycle.
In the final ascent phase — right now — we are reducing our equity exposure. We have moved from seventy percent invested down to forty percent. We are raising cash to thirty to forty percent. We have tightened our stop‑losses on existing positions to just three to five percent. We are not initiating new longs except for the rarest, highest‑conviction setups. We have also begun initiating small short positions on the most overextended mega‑cap stocks.
In the correction phase — which we expect to begin in mid‑2026 — we will reduce our equity exposure further, to perhaps ten or twenty percent. We will focus only on defensive sectors like healthcare and consumer staples. We will raise cash to fifty or sixty percent. We will add to our short positions. And we will build a watch list of high‑quality growth stocks that are pulling back to their fifty‑day and two‑hundred‑day moving averages. We are not buying yet. We are preparing.
In the capitulation phase — late in the third quarter of 2026 — we will act. We will cover all short positions immediately. We will deploy at least half of our cash within five days of that capitulation candle. We will increase our equity exposure to sixty to eighty percent. We will buy the stocks on our watch list without hesitation. This is the moment that separates the disciplined from the emotional. We intend to be disciplined.
In the recovery phase — from late 2026 through 2027 — we will stay fully invested at seventy to ninety percent equity exposure. We will hold our winners and let them run. We will only take partial profits when a stock becomes dangerously overbought — when its relative strength index exceeds eighty and it is trading more than twice its average true range above its fifty‑day moving average. Otherwise, we sit tight and let compounding work.
Probabilities, Not Predictions
We want to be clear about something important. We do not predict the future. No one can. What we do is assign probabilities and then size our bets accordingly.
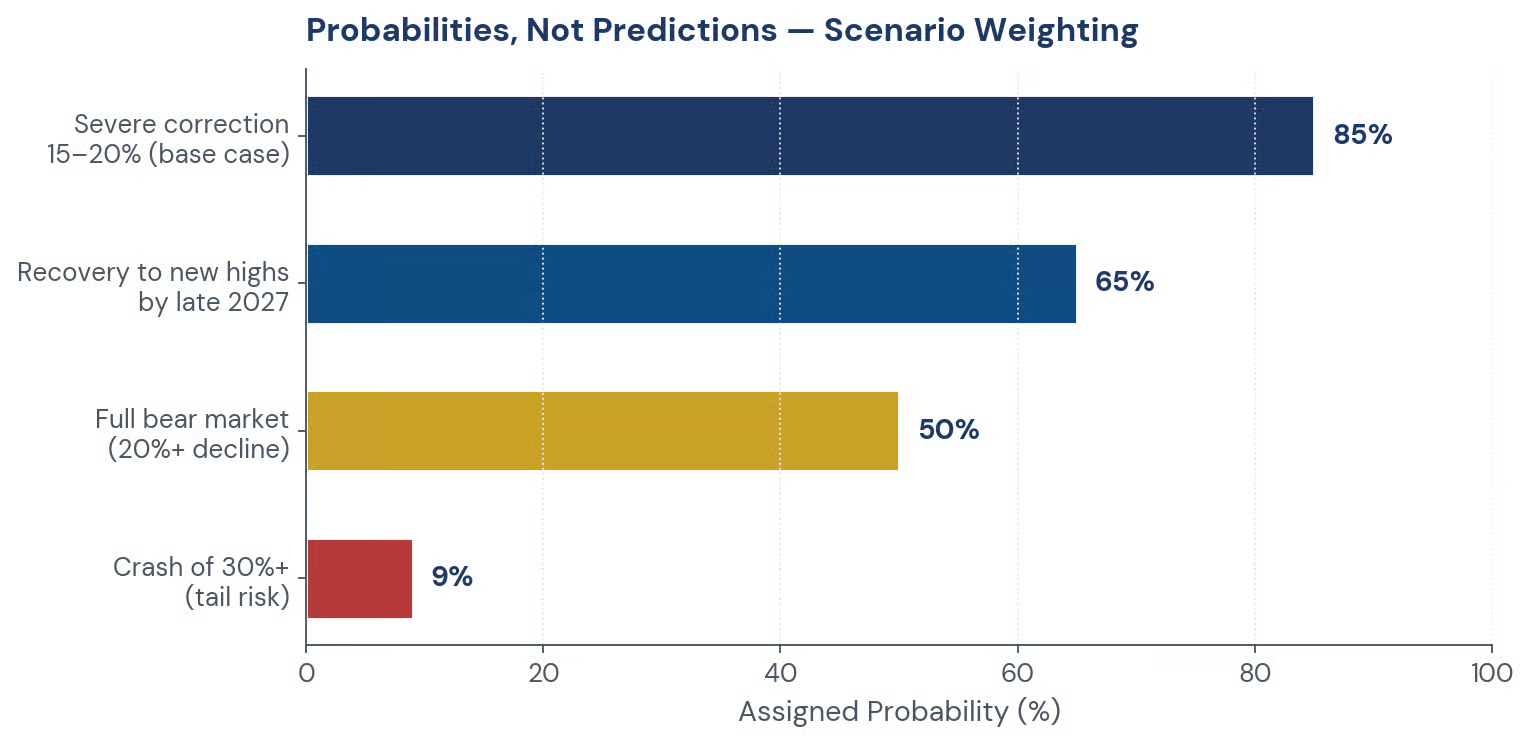 Figure 6. Scenario probabilities — our central expectations, not predictions.
A severe correction of fifteen to twenty percent: we assign an eighty‑five percent probability. This is our base case. We are positioned for it.
A full bear market of twenty percent or more: we assign a fifty percent probability. This is a coin flip. We are moderately prepared, with puts and cash.
A crash of thirty percent or more: we assign an eight to ten percent probability. This is a tail risk. We are not expecting it, but we are not ignoring it either. Our stop‑losses and our cash reserve protect us.
A recovery to new highs by late 2027: we assign a sixty‑five percent probability. This is our highest‑conviction long‑term view. We will buy the panic and ride the recovery.
Notice that these probabilities add up to more than one hundred percent. That is because they are not mutually exclusive. We could have a correction, then a bear market, then a crash, then a recovery. Or we could have a mild correction and then a rapid recovery. The path is uncertain. The destination is what matters.
The Behavioural Traps We Must Avoid
No discussion of market strategy is complete without a discussion of human nature. We are our own worst enemies.
The first trap is recency bias. After a long bull market, we forget that bear markets exist. We become complacent. We assume that stocks only go up. This is when we are most vulnerable. Our discipline is our only defence.
The second trap is loss aversion. The pain of a loss is psychologically twice as powerful as the pleasure of an equal gain. This is why investors sell at the bottom. The fear becomes unbearable. We have built our stop‑loss rules precisely to remove emotion from this decision. We decide before we buy how much we are willing to lose. Then we let the machine execute.
The third trap is herding. When everyone is buying, we want to buy. When everyone is selling, we want to sell. This is the path to ruin. Our process is explicitly contrarian. We buy when sentiment is extreme to the downside. We sell when sentiment is extreme to the upside. We go against the crowd because the crowd is almost always wrong at extremes.
The fourth trap is overconfidence. After a few winning trades, we begin to believe we are geniuses. This is when we take excessive risks. This is when we abandon our process. We fight this by keeping a trading journal. Every trade, win or loss, is recorded with our rationale. Every quarter, we review our mistakes. Humility is not a virtue in this business. It is a necessity.
The Bottom Line — A Summary for the Busy Reader
If you remember nothing else from this newsletter, remember these seven points.
First, we are in a late‑stage bull market with extreme valuations, complacent sentiment, and narrowing breadth. The conditions for a significant correction are in place.
Second, we expect the S&P 500 to make one final high between seven thousand and seven thousand five hundred points before rolling over.
Third, a correction of fifteen to twenty percent is highly probable, with a target range of five thousand nine hundred to six thousand one hundred.
Fourth, the capitulation low — the best buying opportunity in years — will likely occur in late 2026, with a potential overshoot to five thousand six hundred to five thousand eight hundred.
Fifth, the subsequent recovery should carry the S&P 500 to new highs of seven thousand two hundred to eight thousand by late 2027.
Sixth, we are positioning now by raising cash, tightening stops, and preparing our buy list. We will act decisively at the point of maximum pessimism.
Seventh, and most important, we will not be ruled by emotion. We have a process. We trust it. We execute it. The market will do what it does. We will do what we do.
Thank you for reading. As always, we welcome your questions and your skepticism. In this business, blind faith is the enemy. Clear thinking is the only ally.
DISCLAIMER This newsletter is published for informational and educational purposes only. Nothing contained herein constitutes investment advice, a solicitation, or a recommendation to buy or sell any financial instrument. Past commentary does not guarantee future results. Please consult a licensed financial advisor before making any investment decisions. |