Macro Japan
The Contrarian Opportunity in Our Own Backyard
Bull, Bear, Bust · 4 May 2026 · 22 min read
MONTHLY RESEARCH · JAPANESE EQUITIES
May 2026 Market Report: Japanese Equities
Bull, Bear, Bust · The Monthly Macro Memo · May 2026
We have spent considerable time in recent reports discussing the risks in US equities and the selective opportunities in China. But we would be remiss if we did not turn our attention to a market that is closer to home, deeply misunderstood, and — in our view — presenting one of the most compelling contrarian opportunities in the developed world.
Japan is different. It is not just another developed market. It is a market that has been left for dead by global investors for three decades, only to quietly transform itself while no one was watching. Corporate governance is improving. Shareholder returns are rising. Valuations are cheap relative to the US. And the Bank of Japan is finally normalising policy — a sign that the country has escaped the deflationary trap that crippled it for 30 years.
But Japan is not without risks. The yen remains weak. Energy imports are expensive. The domestic consumer is still finding their feet. And the global environment — particularly the US and China — poses genuine headwinds.
This report applies our evidence-based MEVT framework (Monetary, Economic, Valuation, Technical) to the Japanese equity market. We will show you exactly what our indicators are saying, how we are positioned, and what our roadmap looks like for the next 12 months.
As always, this is educational. It is transparent. And it explains what we are doing and why.
Let us begin.
KEY POINTS A quick-read snapshot of this newsletter's commentary
▸ We apply the MEVT framework to Japan. All four pillars lean positive; the weight of evidence is bullish — selectively. ▸ Monetary backdrop is normalising slowly: BoJ at 0.75%, base case 1.00% by July 2026, terminal ~1.5% by mid-2027. Real rates remain negative throughout. ▸ Economic recovery is two-speed: manufacturing expanding at 51.6, services moderating at 53.4. Real wages expected to turn positive in 2026 — the critical domestic tailwind. ▸ Valuations are compelling: TOPIX trades at 16.2x forward earnings vs. S&P 500 at 22-23x (-27% discount); P/B 1.7x vs US 4.5-5.0x; small caps at -38% discount to US peers. ▸ Technicals are constructive: Nikkei above 50- and 200-day moving averages, Golden Cross intact, breadth improving, sentiment cautious not euphoric. ▸ Our 12-month roadmap targets the Nikkei at 66,000 by April 2027 via seven phases: consolidation, hike, decoupling, relative-strength rally, year-end rally, wage confirmation, fiscal new year. ▸ Current positioning: 3-5% Japan overweight; long semiconductors / equipment, automobiles, trading companies; underweight banks, real estate, utilities; 10% cash buffer. ▸ We are positioning for a modest overweight based on the weight of evidence, with clear triggers to add or reduce as conditions change. |
Part One: The Japanese Exception — Why This Time May Be Different
Before we dive into the indicators, we need to acknowledge the elephant in the room. Japan has broken the hearts of value investors for three decades. Every time it looked like a recovery was coming, it fizzled. Every time valuations looked cheap, they got cheaper.
So why is this time different?
Three structural shifts give us confidence that the Japanese market is not the same trap it was in the 1990s and 2000s.
First, corporate governance reform is producing measurable results. The Tokyo Stock Exchange has been pressuring companies with price-to-book ratios below one to address their capital efficiency. And they are listening. Share buybacks are at record levels. Dividends are rising. Merger and acquisition activity is robust. Cross-shareholdings are being unwound. Companies are finally being run for shareholders, not for bankers and bureaucrats.
Second, the end of deflation appears genuine. After three decades of falling or stagnant prices, Japan is seeing sustained wage growth and modest inflation. The latest data shows core inflation at 1.3 per cent year-on-year, down from recent peaks but still positive. The Bank of Japan's own forecasts now assume inflation will stabilise around the 2 per cent target over the forecast horizon. This changes the nominal growth equation for corporate earnings in ways that equity markets have been slow to price.
Third, valuations remain depressed relative to the United States. The TOPIX is trading at 16.2 times forward earnings — a 27 per cent discount to the S&P 500. On a price-to-book basis, the TOPIX trades at just 1.7 times book value, roughly two-thirds lower than the United States. Japanese small caps trade at 13.9 times forward earnings, a 38 per cent discount to US small caps. These valuation gaps are not new, but they are unusually wide by historical standards.
None of this guarantees a re-rating. But it does create a margin of safety that is increasingly rare in global markets.
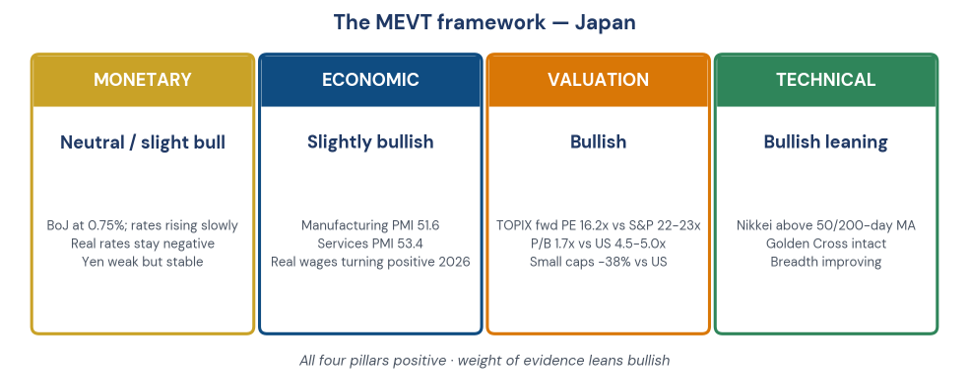 Figure 1. The MEVT framework applied to Japan — all four pillars currently positive.
Part Two: Monetary Indicators — The Bank of Japan's Delicate Dance
Monetary conditions in Japan are arguably more important than anywhere else. For decades, the Bank of Japan was the most aggressive easer in the world — negative rates, yield curve control, massive balance sheet expansion. That era is now ending.
Here is what our monetary dashboard is showing.
Policy Rate and Forward Guidance
The Bank of Japan kept its policy rate unchanged at 0.75 per cent at its April 28 meeting. This was a 6-3 vote, marking the largest dissent against a hold decision in the past three years under Governor Ueda. This tells us that internal pressure for further tightening is building.
The Bank's updated macroeconomic forecasts reinforce this tilt. The Bank revised down its FY2026 GDP growth forecast from 1.0 per cent to 0.5 per cent, while raising its FY2026 core CPI forecast more sharply from 1.9 per cent to 2.8 per cent. In plain English: they now expect slower growth but higher inflation — a classic stagflationary tilt that typically forces central banks to tighten policy even when the economy is weak.
Our base case, consistent with several major forecasts, is for the Bank of Japan to raise rates by 25 basis points to 1.00 per cent by July 2026. This would be followed by additional rate hikes at a pace of approximately 25 basis points every six months, with the terminal rate reaching 1.5 to 1.75 per cent by mid-2027.
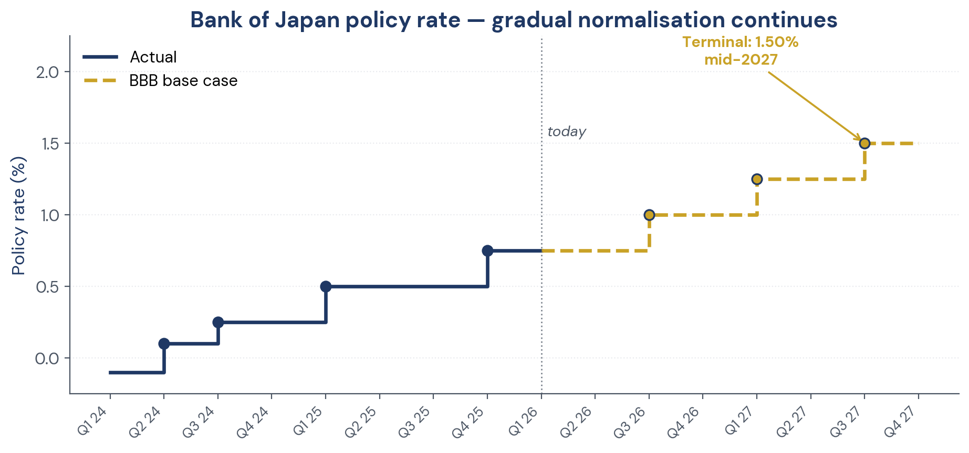 Figure 2. Bank of Japan policy rate — gradual normalisation continues; terminal ~1.50% by mid-2027.
What This Means for Equities
A rising rate environment is not typically bullish for equities. But Japan is different. The Bank of Japan is raising rates not because the economy is overheating, but because it is finally escaping deflation. In this context, rate normalisation is a signal that the patient is healthy enough to stand on their own two feet.
Moreover, real interest rates — nominal rates minus inflation — are expected to remain negative throughout the forecast period. This means that monetary conditions, even after rate hikes, will remain accommodative in real terms. The Bank is not trying to crush the economy. They are trying to normalise after three decades of emergency measures.
The Yen
The yen remains weak, trading around 159 to the US dollar. A weak yen is a double-edged sword. It benefits exporters by making their goods cheaper overseas and inflating the value of overseas profits when repatriated. But it hurts consumers and importers by raising the cost of energy, food, and raw materials.
Our view is that the yen will remain weak for the foreseeable future — perhaps stabilising in the 150 to 160 range. This is a modest tailwind for Japanese equities, particularly for export-oriented sectors like automobiles and semiconductors.
Summary of Monetary Indicators
The Bank of Japan is normalising policy, but at a glacial pace. Real rates remain negative. The yen is weak but stable. The monetary backdrop is not a headwind for Japanese equities. At the margin, it is a modest tailwind.
Part Three: Economic Indicators — A Gradual Recovery, Not a Boom
Japan's economy is healing, but slowly. The headline numbers show a country in recovery, but the details reveal a more nuanced picture.
GDP Growth
Real GDP growth for the fourth quarter of 2025 turned positive at an annualised 0.2 per cent quarter-on-quarter, following a sharp contraction of 2.6 per cent in the third quarter. While positive, the rebound was modest relative to the magnitude of the prior decline.
For the full fiscal year 2025 (ending March 2026), GDP growth is estimated at approximately 0.7 per cent. For fiscal 2026, forecasts cluster around 0.8 to 0.9 per cent. On a calendar year basis, we expect growth of approximately 0.6 per cent in 2026 and 1.0 per cent in 2027.
This is not a booming economy. It is a slow, grinding recovery. But in the context of an aging, shrinking population, these growth rates are actually quite respectable. Per capita growth is higher than the headline numbers suggest.
The Two-Speed Economy: Manufacturing vs. Services
Here is where the story gets interesting.
The manufacturing sector is showing genuine strength. The Manufacturing Purchasing Managers' Index stood at 51.6 in March 2026. This is down slightly from 53.0 in February but remains in expansion territory. More importantly, the drivers of this strength are structural. Global demand for AI-related semiconductors and industrial automation is robust. Japan is a key supplier to this global supply chain.
The services sector is softer. The Services PMI fell to 53.4 in March, down from 53.8 in February. While still in expansion, the trend is moderating. Business conditions for small and medium-sized enterprises, as well as the consumer-facing parts of the economy, remain challenging.
This two-speed dynamic is characteristic of a recovery that is being led by exports and business investment, not domestic consumption.
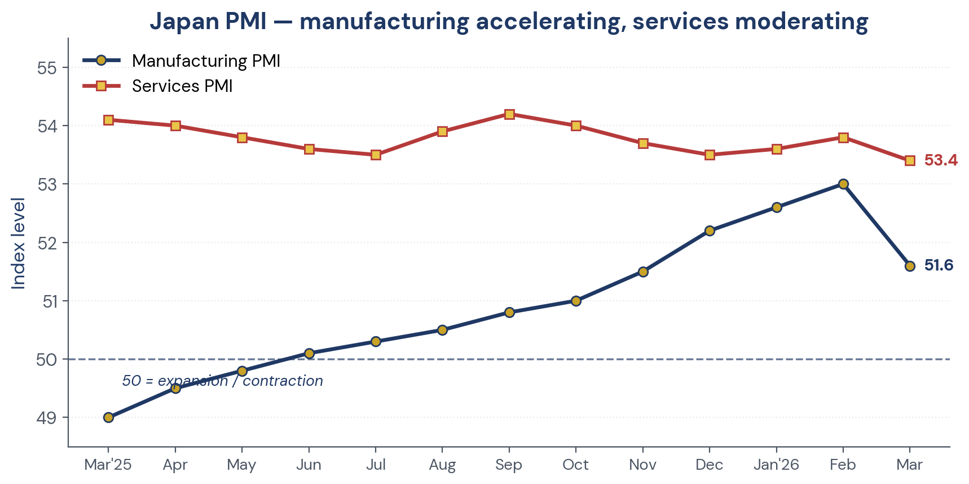 Figure 3. Japan Manufacturing PMI accelerating, Services PMI moderating — a two-speed recovery.
Real Wages and Consumption
Here is the most critical part of the Japanese economic story for 2026.
Throughout 2025, wage growth lagged inflation, resulting in sustained declines in real wages. This crushed household purchasing power and constrained the recovery in private consumption.
But the outlook for 2026 is improving. The spring labour negotiations are expected to deliver wage increases of approximately 5.45 per cent — the third consecutive year of gains in the 5 per cent range. Momentum for wage increases remains firm amid intensifying labour shortages. There is growing recognition among both labour and management of the need to restore real wages after a prolonged period of high inflation.
At the same time, inflation is moderating. Policy measures — including the abolition of the former provisional gasoline tax rate and the resumption of electricity and gas subsidies — are likely to push CPI inflation below 2 per cent year-on-year in the first quarter of 2026. Core CPI (excluding fresh food) is projected to rise 2.7 per cent in fiscal 2025, but only 1.8 per cent in fiscal 2026 and 1.9 per cent in fiscal 2027.
The combination of rising wages and moderating inflation means that real wages are expected to return to positive territory in 2026 for the first time in several years. This should support private consumption and provide a domestic tailwind to the economy.
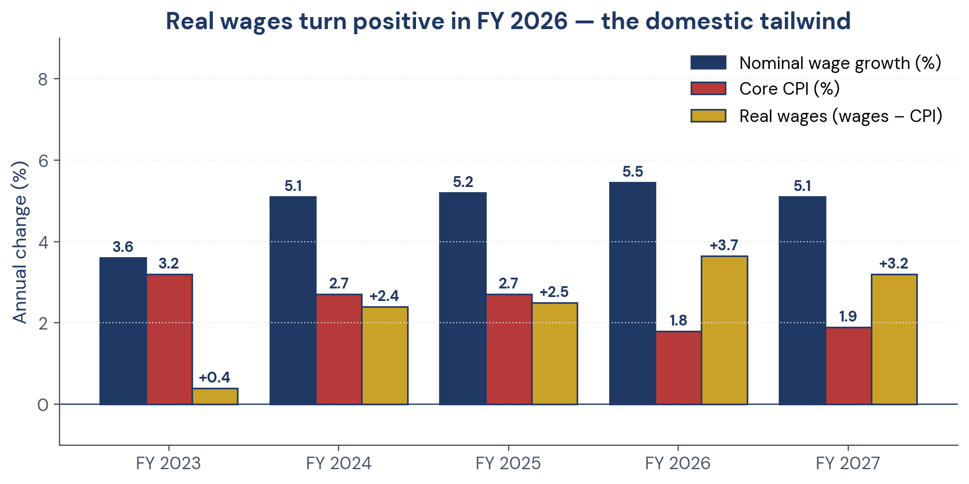 Figure 4. Real wages turn positive in FY 2026 — the domestic consumption tailwind.
The Risks to This Outlook
We are watching three risks closely.
First, external demand from the United States and China. If the US economy slows more sharply than expected — consistent with our bearish global roadmap — Japanese exports will suffer. Similarly, Japan-China relations remain strained. A deterioration in trade or political relations would be a significant headwind.
Second, energy prices. Japan imports virtually all of its oil and gas. If the Middle East conflict escalates further and oil prices spike, the terms of trade deterioration will hit Japanese corporate earnings and household incomes simultaneously. This is a stagflationary shock that would overwhelm the positive dynamics we have described.
Third, yen depreciation beyond current levels. While a weak yen is helpful for exporters, excessive depreciation raises the cost of living for households and the cost of imports for businesses. If the yen were to fall to 170 or 180 against the dollar, the negatives would likely outweigh the positives.
Summary of Economic Indicators
The Japanese economy is healing, but slowly. The recovery is being led by manufacturing and exports, not domestic consumption. The critical development to watch is the return of real wage growth, which we expect in 2026. If this materialises, the recovery broadens. If it does not, the economy remains fragile.
Part Four: Valuation Indicators — The Compelling Case for Japan
This is where the Japanese market becomes genuinely interesting relative to global peers.
Price-to-Earnings (P/E)
The TOPIX is currently trading at 16.2 times forward earnings. By comparison, the S&P 500 is trading at approximately 22 to 23 times forward earnings. That is a discount of roughly 27 per cent.
Japanese small caps are even cheaper, trading at just 13.9 times forward earnings. This represents a 38 per cent discount to US small caps, which trade at approximately 22.6 times forward earnings.
Relative to Japan's own history, these multiples are not historically cheap. But they are not expensive either. The discount to the US, however, is unusually wide.
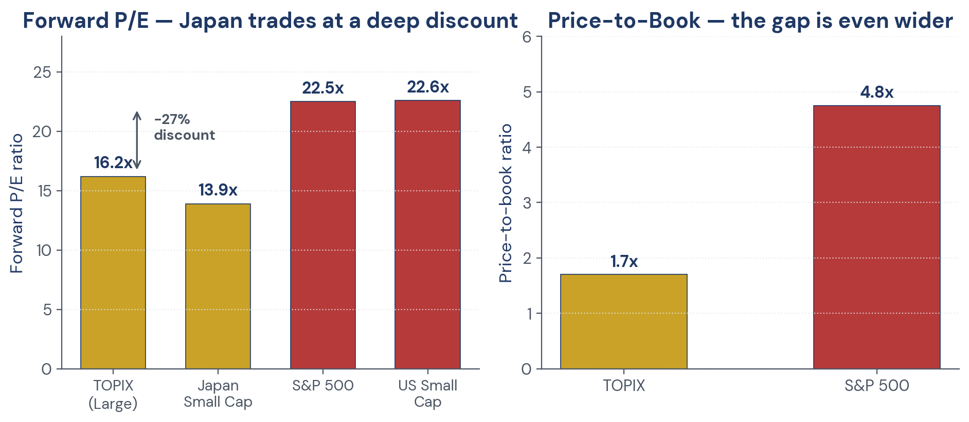 Figure 5. Forward P/E and P/B — Japan trades at a deep discount to the US on both measures.
Price-to-Book (P/B)
This is where the valuation case is strongest. The TOPIX is trading at just 1.7 times book value. The S&P 500 trades at approximately 4.5 to 5.0 times book value.
This discount reflects the market's scepticism about Japanese return on equity. But corporate governance reforms are slowly improving ROE. If Japanese companies continue to improve their capital efficiency, the P/B multiple should re-rate upwards.
The Buffett Indicator — Japan Version
Unlike the United States, where the Buffett Indicator stands at nearly 200 per cent of GDP, Japan's total market capitalisation to GDP is significantly lower. We estimate Japan's market cap to GDP at approximately 120 to 130 per cent. This is elevated relative to Japan's own history but not in the danger zone of US valuations.
Sector Valuation Dispersion
Not all of Japan is cheap. There is significant dispersion across sectors.
Export-oriented sectors — semiconductors, automobiles, industrial machinery — trade at higher multiples, reflecting their stronger earnings growth. Domestically oriented sectors — retail, real estate, utilities — trade at lower multiples, reflecting weaker domestic demand.
We are watching the valuation gap between exporters and domestic names. If real wages recover and domestic consumption improves, we would expect domestic names to outperform.
Summary of Valuation Indicators
Japanese equities are not universally cheap, but they are significantly cheaper than their US counterparts. The valuation gap is wide enough to provide a margin of safety. Small caps, in particular, offer compelling value.
Part Five: Technical Indicators — What the Charts Are Saying
The technical picture for Japanese equities is mixed. The Nikkei 225 hit all-time highs in 2024, pulled back sharply in 2025, and is now consolidating.
Trend Following
The Nikkei 225 closed April at approximately 58,100 points. This is above both the 50-day and 200-day moving averages, indicating a medium-term uptrend. The Golden Cross — where the 50-day moves above the 200-day — occurred earlier in the recovery and remains intact.
Our moving average summary currently shows more buy signals than sell signals across multiple periods. The trend is positive but not overextended.
Breadth
We do not have comprehensive breadth data for the full TOPIX universe in this report, but anecdotal evidence suggests that participation has been improving. The Tankan survey — the Bank of Japan's quarterly business sentiment survey — shows large manufacturers at 15, up from the prior quarter, and non-manufacturers at a very strong 21, well above the 2014 to 2019 average of 11.
Improving business sentiment typically precedes improving market breadth.
Sentiment
Sentiment toward Japanese equities remains cautious, not euphoric. Foreign investors have been net sellers of Japanese equities over the past year, reflecting a structural underweight position. When foreign sentiment turns, the buying pressure can be significant.
Summary of Technical Indicators
The technical picture is constructive. The trend is up. Breadth is improving. Sentiment is not overheated. The charts are not screaming "buy", but they are also not flashing warning signs.
Part Six: The Bank of Japan's Delicate Balancing Act
No analysis of Japanese markets is complete without addressing the central bank's policy dilemma.
The Inflation Outlook
The Bank of Japan's latest forecasts show core inflation (excluding fresh food) at 2.8 per cent for fiscal 2026, up sharply from the previous forecast of 1.9 per cent. This revision reflects higher energy prices from the Middle East conflict and the pass-through of wage increases into service prices.
For the first time, the Bank's quarterly outlook explicitly pointed to the risk of a wage-inflation spiral. This is significant. It suggests that the Bank believes the virtuous cycle of rising wages and rising prices — which they have been trying to engineer for decades — may finally be taking hold.
The Rate Path
The market expects the Bank to raise rates to 1.00 per cent by July 2026. Thereafter, the pace is uncertain. Oxford Economics expects hikes every six months — June and December 2026, and June 2027 — taking the terminal rate to 1.5 per cent. BNP Paribas has a similar forecast, with a terminal rate of 1.5 per cent by mid-2027.
We are comfortable with this consensus. The Bank will move slowly and communicate clearly. They have no interest in shocking the market or the economy.
The Fiscal Wildcard
Prime Minister Takaichi's government has adopted an expansionary fiscal stance. An initial stimulus package valued at 21.3 trillion yen (approximately 3.8 per cent of GDP) has been adopted to support households amid inflationary pressures.
This fiscal expansion has two implications for our equity view. First, it supports domestic demand, particularly consumption. Second, it puts upward pressure on bond yields and the yen, which could offset some of the benefits of the weak currency for exporters.
The net effect is likely modestly positive for Japanese equities, with domestic-oriented sectors benefiting more than exporters.
Part Seven: Putting It All Together — The Weight of Evidence
Let us score Japan across our four pillars.
Monetary indicators: The Bank of Japan is normalising policy at a glacial pace. Real rates remain negative. The yen is weak but stable. Verdict: Neutral to slightly bullish.
Economic indicators: The economy is healing slowly. Manufacturing is strong. Real wages are expected to return to positive territory in 2026. The recovery is broadening. Verdict: Slightly bullish.
Valuation indicators: Japanese equities are significantly cheaper than US equities on both P/E and P/B. Small caps offer compelling value. The valuation gap provides a margin of safety. Verdict: Bullish.
Technical indicators: The trend is up. Breadth is improving. Sentiment is not overheated. Verdict: Bullish leaning.
Weight of evidence: The balance leans positive. Japan offers a combination of cheap valuations, improving fundamentals, and a supportive policy backdrop that is difficult to find elsewhere in the developed world.
Part Eight: The 12-Month Roadmap for Japanese Equities — Month by Month
Given the weight of evidence described above, here is our probabilistic roadmap for Japanese equities over the next 12 months.
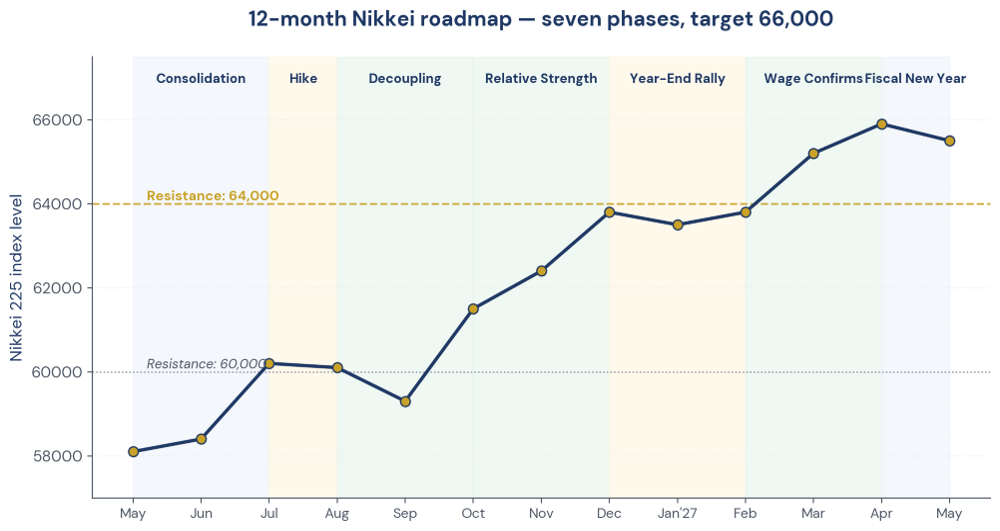 Figure 6. 12-month Nikkei roadmap — seven phases, target 66,000 by April 2027.
Month 1 — May 2026: The Consolidation
The Nikkei trades between 58,000 and 60,000. The market digests the Bank of Japan's April meeting and awaits the July rate decision. Earnings season provides selective opportunities. Our positioning: Neutral. Holding our core positions. Not adding aggressively.
Month 2 — June 2026: The Rate Hike Prep
The Bank of Japan signals clearly that a July rate hike is coming. The yen strengthens modestly on the news. Exporters dip, domestics rally. Volatility increases. Our positioning: Opportunistic. Buying dips in export leaders. Adding to domestic consumption names in anticipation of real wage recovery.
Month 3 — July 2026: The Hike and The Guidance
The Bank raises rates to 1.00 per cent as expected. Forward guidance suggests another hike in six months, but emphasises data dependence. The market takes it in stride. The Nikkei breaks above 60,000. Our positioning: Increasing exposure. Moving from neutral to modestly overweight.
Month 4 — August 2026: The Summer Lull
Trading volume drops. The market consolidates. No major catalysts. Our positioning: Holding. Tightening stops on the most extended names.
Month 5 — September 2026: The Autumn Test
US markets begin to roll over as our bearish global roadmap plays out. Japanese equities initially sell off in sympathy, but the sell-off is shallower than in the US. The decoupling narrative begins. Our positioning: Opportunistic. Adding to positions sold off during global panic.
Month 6 — October 2026: The Relative Strength Trade
Global investors begin to rotate from US equities into cheaper, more resilient markets. Japan is a primary beneficiary. Foreign buying returns. The Nikkei outperforms the S&P 500 meaningfully. Our positioning: Overweight Japan. Fully allocated within our Asia bucket.
Month 7 — November 2026: The Domestic Recovery Story
Real wage data confirms positive growth for the second consecutive quarter. Domestic consumption names — retail, real estate, utilities — begin to catch up to exporters. The rally broadens. Our positioning: Rotating. Taking some profits on exporters. Adding to domestic names.
Month 8 — December 2026: The Year-End Rally
The Bank of Japan raises rates to 1.25 per cent as expected. The market barely notices. Liquidity is strong. The Nikkei makes a run at 64,000. Our positioning: Cautious. The rally may be getting extended. Beginning to trim.
Month 9 — January 2027: The Consolidation
The market pauses. 64,000 proves to be psychological resistance. Volume dries up. Investors wait for corporate guidance. Our positioning: Neutral. Holding core positions. No new initiations.
Month 10 — February 2027: The Reassessment
The Bank of Japan's quarterly outlook is released. Growth forecasts are trimmed slightly, inflation forecasts are raised slightly. The message is unchanged — gradual normalisation continues. Our positioning: Neutral to slightly positive. Adding selectively to oversold value names.
Month 11 — March 2027: The Spring Wage Negotiations
The annual spring labour negotiations deliver another strong result — wage increases in the 5 per cent range for the fourth consecutive year. This confirms that the wage-inflation dynamic is structural, not transitory. Domestic consumption names rally sharply. Our positioning: Overweight domestic-oriented sectors.
Month 12 — April 2027: The Fiscal New Year
April marks the start of the new fiscal year in Japan. Government spending kicks in. The economic data improves. The Nikkei makes a run at 66,000. Our positioning: Reducing overweight to neutral. Locking in gains. Preparing for the next cycle.
Part Nine: Sectors We Are Watching Closely
Within the Japanese market, we are not taking a blanket approach. We are being selective.
Semiconductors and Semiconductor Equipment
This is our highest conviction theme. Tokyo Electron, Disco, and Lasertec are global leaders in semiconductor manufacturing equipment. As long as the world needs more computing power — and AI ensures that it will — these companies have pricing power that is distinct from consumer-facing technology. The recent pullback in semi names has created an attractive entry point.
Automobiles
The Japanese automobile industry is in the midst of a historic transition from internal combustion to electric vehicles. Toyota, Honda, and Nissan are investing heavily. The weak yen is a significant tailwind. We are selectively adding to names with credible EV strategies and strong balance sheets.
Trading Companies and Value Cyclicals
Mitsubishi Corporation, Mitsui, and Itochu were Warren Buffett's entry point into Japan for a reason. They are diversified conglomerates with exposure to energy, metals, food, and infrastructure. They generate substantial free cash flow. They are returning capital to shareholders. At current valuations, we find them attractive.
Sectors We Are Avoiding
We are avoiding Japanese banks, which are exposed to the domestic economy and will face margin pressure as rates rise. We are avoiding real estate, which is sensitive to rising yields. We are avoiding utilities, which are struggling with high import costs.
Part Ten: Risks We Are Monitoring
Global recession risk
If the United States falls into a deep recession, Japanese exports will suffer. This is our primary macro concern. We are monitoring our US recession indicators closely.
Yen volatility
If the yen weakens beyond 160 to the dollar, the negatives for consumers and importers may outweigh the positives for exporters. If the yen strengthens sharply, the competitiveness of exporters will be hurt. We are watching currency volatility, not just levels.
Geopolitical escalation
Japan-China relations remain strained. A deterioration in trade or political relations would be a significant headwind. Taiwan remains a flashpoint.
Energy prices
Japan imports virtually all of its oil and gas. If the Middle East conflict escalates further, the terms of trade shock will be severe.
Policy missteps
The Bank of Japan could hike too quickly, choking off the recovery. Or they could hike too slowly, allowing inflation to become entrenched. This is a difficult balancing act.
Part Eleven: What We Are Doing Now — Current Positioning
Based on the current weight of evidence, here is our current positioning in Japanese equities.
Overall exposure: We are approximately 3 to 5 per cent overweight Japan relative to our strategic benchmark. This is a moderate overweight, not an aggressive one.
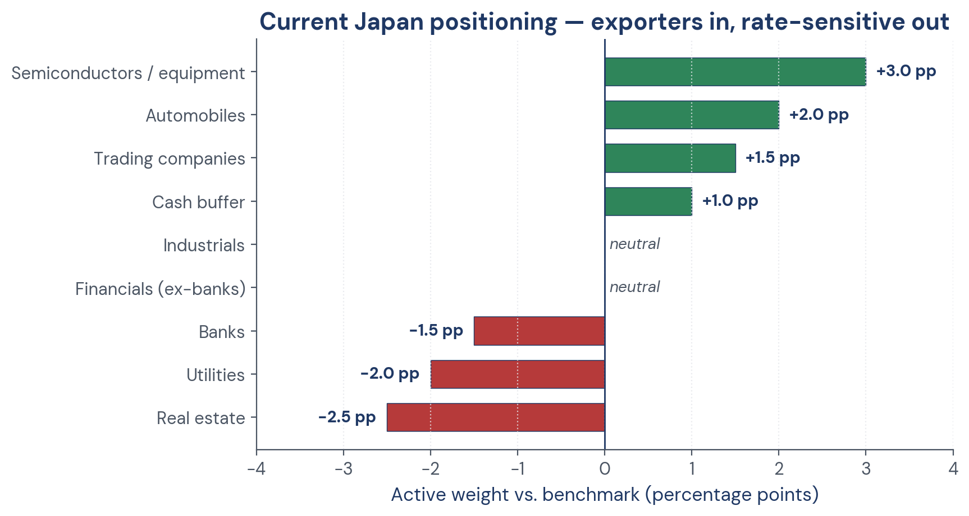 Figure 7. Current Japan positioning — overweight exporters and structural themes, underweight rate-sensitives.
Within Japan: We are overweight semiconductors and semiconductor equipment, automobiles, and trading companies. We are market-weight financials and industrials. We are underweight real estate and utilities.
Implementation: We are using a mix of direct Japanese equities (via our custody arrangements), Japanese equity ETFs for broader exposure, and ADRs for smaller positions.
Hedging: We hold limited put options on the TOPIX as a tail hedge. The cost is low. The protection is valuable.
Cash: We hold 10 per cent cash within our Japan sleeve. This is higher than normal. We want dry powder for the inevitable volatility.
Closing Thoughts
Japanese equities occupy a unique place in the global investment landscape. They are cheaper than the United States. They are supported by a central bank that is finally normalising policy after three decades of emergency measures. They have a corporate governance tailwind that is producing measurable improvements in shareholder returns. And they are benefiting from a manufacturing recovery that is being driven by AI, automation, and the global transition to electric vehicles.
But they are not without risks. The global economy could slow. The yen could become a headwind. Energy prices could spike. And the domestic consumer recovery could fail to materialise.
Our approach is selective. We favour semiconductors, automobiles, and trading companies. We avoid banks, real estate, and utilities. We maintain higher than normal cash. And we watch the technical signals closely.
We are not predicting a Japanese super-cycle. We are not predicting a crash. We are positioning for a modest overweight based on the weight of evidence, with clear triggers to add or reduce as conditions change.
As always, we remain vigilant, not fearful. We follow the data. We trust the process. And we keep you informed every step of the way.
DISCLAIMER This newsletter is published for informational and educational purposes only. Nothing contained herein constitutes investment advice, a solicitation, or a recommendation to buy or sell any financial instrument. All investment involves risk, including the loss of principal. Past commentary does not guarantee future results. Any views expressed are those of the author as of the date of publication and are subject to change without notice. Please consult a licensed financial advisor before making any investment decisions. |