Gold Equities Housing
The Monetary Cycle
Bull, Bear, Bust · 29 May 2026 · 15 min read
MONTHLY RESEARCH · THE MONETARY CYCLE
Its impact on Gold, Equities and Housing — 1970 to May 2026
Bull, Bear, Bust · The Monthly Macro Memo · May 2026
Here's a clear, data-anchored comparison from 1970 to May 2026 across the four things you asked: Gold (1 oz bar), US dollar purchasing power, US housing (median home), and the Dow Jones Industrial Average.
KEY POINTS A quick-read snapshot of this newsletter's commentary
▸ Since 1970, gold has returned ~135× (~16× real), the Dow ~57× (~6-7× real), median housing ~18× (~2× real), while the US dollar lost ~88% of its purchasing power. ▸ Most gains you see in markets are currency illusion — gold is the measuring stick, the dollar is the variable. ▸ The Dow/Gold ratio is the master long-cycle indicator. 1970: 24:1. 1980: 1:1. 2000: 40:1. 2011: 6:1. Today: ~10:1. Translation: we are mid-way through a gold cycle, not at the end. ▸ Houses got more expensive in dollars but cheaper in gold — the real-value band for a median US house sits at ~100–300 oz; today ~100-160 oz. ▸ We are in late-stage monetary expansion plus early hard-asset rotation: persistent inflation, sovereign debt instability, central bank credibility erosion, gold breaking into new structural highs. ▸ Three triggers historically collapse the Dow/Gold ratio: real rates going negative, credit-system stress, and policy panic — all three signals are present now. ▸ Allocation today (Dow/Gold ~10): 30-40% gold / hard assets · 30-40% selective equities (tilted to energy and resources) · 10-20% cash · 10-20% optional silver / commodities / asymmetric. ▸ The edge is recognising phase shifts before they are obvious — most people stay in stocks too long, chase gold too late, then miss the final rotation back. |
I'll give you hard numbers first, then the real insight (which is where it gets interesting). Let us begin with the hard numbers.
Baseline Numbers — 1970 versus 2026
Gold (1 oz)
1970: ~$35/oz. 2026: ~$4,600–$5,000/oz. Return: ~130× to 140×.
US Dollar (purchasing power)
$1 in 1970 = ~$8.4–$8.5 today. Loss of purchasing power: ~88% decline.
US Median House
1970: ~$25,000 (typical estimate; aligns with gold ratio data). 2026: ~$400,000–$600,000+ (range depending on index). Return: ~16×–24×.
Dow Jones Industrial Average
1970: ~839. 2025/26: ~48,000. Return: ~57×.
Clean comparison (nominal returns)
- Gold (1 oz): $35 → ~$4,800 → ~135×
- US Dollar: $1 → $0.12 (real value) → −88%
- House: $25k → ~$450k → ~18×
- Dow Jones: 839 → ~48,000 → ~57×
Real versus Nominal — The Part Most People Miss
Nominal returns are misleading. Let's adjust mentally for inflation (~8.5× since 1970):
- Gold: ~135× ÷ 8.5 ≈ ~16× real gain
- Dow Jones: ~57× ÷ 8.5 ≈ ~6–7× real gain
- Housing: ~18× ÷ 8.5 ≈ ~2× real gain
- Cash (USD): destroyed
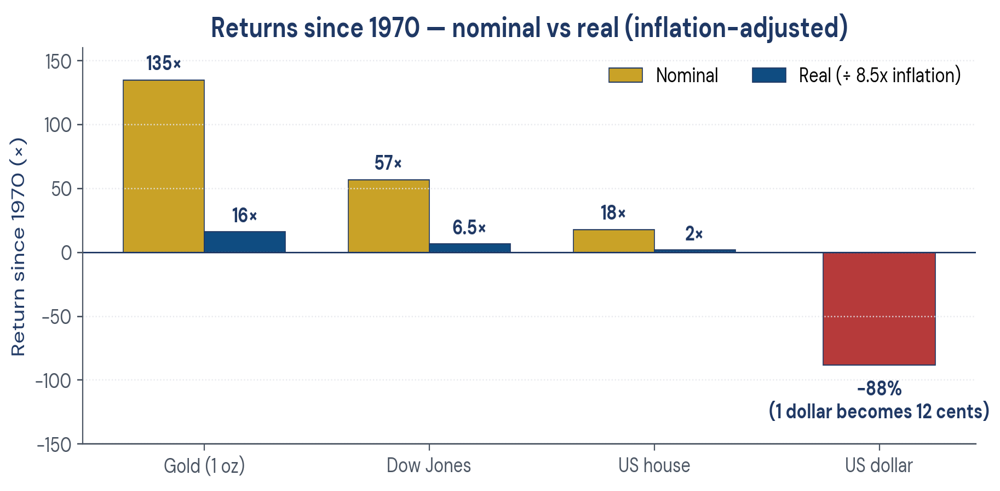 Figure 1. Returns since 1970 — nominal versus real (inflation-adjusted).
The Deeper Truth — This Is the Real Story
Gold versus Dollar — mirror image
Dollar lost ~88%. Gold gained ~130×. Gold didn't "skyrocket" — the dollar was repriced downward.
Gold versus Housing
This is critical.
- 1970: ~714 oz of gold = house
- 2026: ~100–160 oz of gold = house
Houses got more expensive in dollars and cheaper in gold. That's a massive insight most people miss.
Gold versus Dow — cyclical dominance
- 1970: Dow ≈ 839, Gold ≈ 37 → ratio ~22:1
- 1980: ratio ~1:1 (gold peak)
- 2026: ratio ~10:1 (gold strong again)
This tells you: stocks outperform for long periods, then gold resets the system during crises.
Housing is NOT a great long-term real asset
Despite huge nominal gains: real gain ≈ 2× over 56 years.
Most "housing wealth" is leverage (debt) plus inflation illusion.
Final Ranking, 1970–2026
Gold — first place
Best store of value plus crisis hedge. Preserves purchasing power across regimes.
Dow Jones — second place
Best compounder of wealth. But volatile and cycle-dependent.
Housing — third place
Moderate real return. Strongly tied to credit expansion.
US Dollar — last place
Guaranteed long-term loser (by design).
Bottom line — no fluff
- Cash gets destroyed
- Assets absorb monetary expansion
- Gold tracks monetary debasement
- Equities compound productivity
- Housing tracks credit cycles
The Master Signal — Dow / Gold Ratio
Alright — let's go properly deep. I'll strip out the noise and show you the real system underneath the numbers.
This is the most important long-cycle indicator.
Key points in history
- 1970: Dow 839, Gold $35, Ratio ~24:1
- 1980: Dow 850, Gold $850, Ratio ~1:1
- 2000: Dow 11,700, Gold $290, Ratio ~40:1
- 2011: Dow 12,000, Gold $1,900, Ratio ~6:1
- 2026: Dow 48,000, Gold ~$4,800, Ratio ~10:1
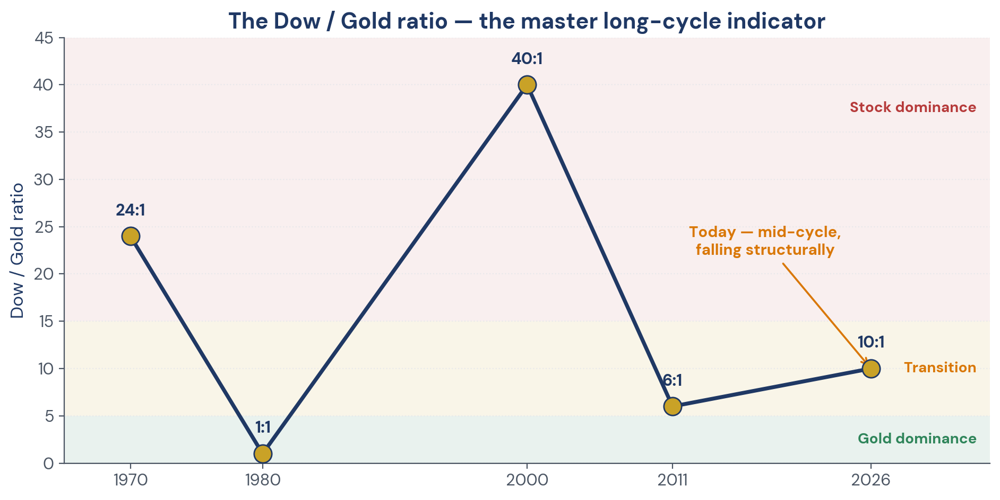 Figure 2. The Dow / Gold ratio — the master long-cycle indicator across five decades.
What this actually means
- High ratio (20–40): Stocks are expensive vs hard assets
- Low ratio (1–5): Gold is expensive vs stocks
The system oscillates between financial assets and hard money.
The repeating cycle
Money printing / credit expansion → stocks boom → ratio rises (20–40). Then crisis / inflation / loss of confidence → gold explodes → ratio collapses (toward 1–5). Then reset. Repeat.
Where we are now (2026)
Ratio ~10:1, falling from ~40 (year 2000 peak). Translation: we are mid-way through a gold cycle, not at the end.
Everything Priced in Gold — The Truth Layer
This removes currency distortion completely.
House price in gold
- 1970: ~714 oz
- 1980: ~100 oz
- 2000: ~1,200 oz
- 2011: ~250 oz
- 2026: ~100–160 oz
Insight: housing hasn't "gone up" — it's oscillating around a real value band of ~100–300 oz.
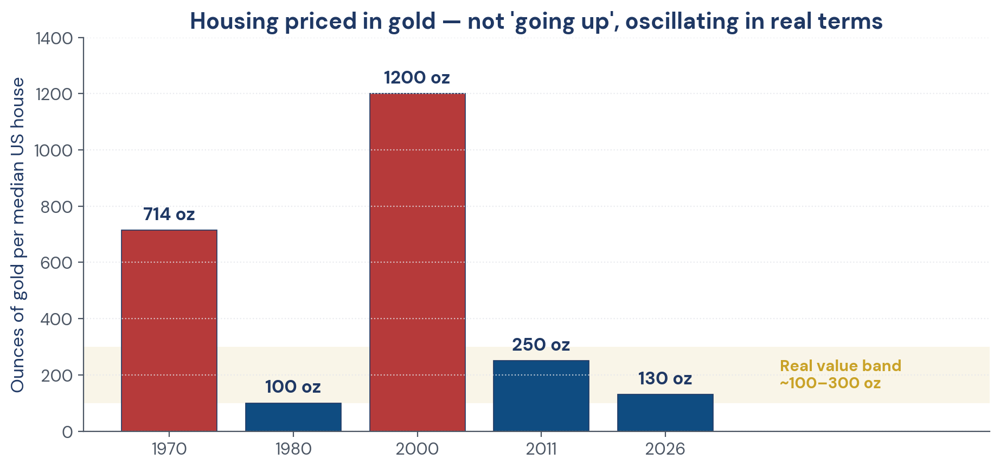 Figure 3. US median house priced in ounces of gold — oscillates in real terms.
Dow priced in gold
- 1980: ~1 oz (bottom)
- 2000: ~40 oz (bubble peak)
- 2011: ~6 oz
- 2026: ~10 oz
Stocks are: not cheap, not extreme, still vulnerable to gold outperformance.
Gold versus dollar
1970 to now: Gold ~135×, Dollar −88%. This is not coincidence — it's monetary policy in action.
The Hidden Engine Behind All This
Everything you're seeing is driven by one thing: the expansion of money plus credit.
Since 1970:
- USD fully detached from gold (1971)
- Debt exploded globally
- Asset prices became the "release valve"
The hierarchy
- Currency — loses value
- Financial assets — stocks, bonds
- Real assets — housing
- Hard money — gold
Each cycle: liquidity flows up the chain, then collapses back toward gold.
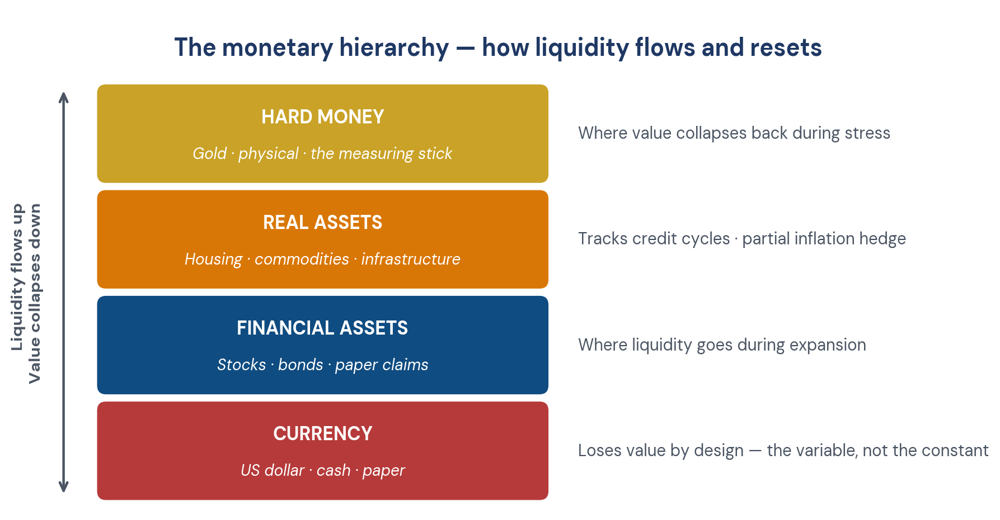 Figure 4. The monetary hierarchy — liquidity flows up, value collapses back down.
Where We Are in the Cycle — 2026
We are in late-stage monetary expansion plus early hard-asset rotation.
Signals
- Persistent inflation pressures
- Sovereign debt instability
- Central bank credibility erosion
- Gold breaking into new structural highs
- Stocks still elevated (but fragile in real terms)
Forward View — The Next 10 to 15 Years
Scenario baseline (most probable):
Gold
Likely continues higher. Possible range: $8,000–$15,000+. Driven by currency debasement, central bank accumulation, and loss of real yield confidence.
Dow (in gold terms)
Even if nominal rises, could fall to a 3:1 to 5:1 ratio. That implies stocks underperform gold significantly.
Housing
In real terms: likely flat or declining. In gold terms: could move toward 100 oz or lower.
US Dollar
Continues gradual erosion. Not collapse — but steady loss of purchasing power.
Strategic Interpretation
If you think in dollars, everything looks like it's rising. If you think in gold, you see reality: stocks fluctuate, housing stagnates, currency decays, gold anchors value.
The big takeaway
This isn't four separate investments. It's one system: a monetary cycle rotating between trust and distrust. Trust in system → stocks win. Distrust in system → gold wins.
Final blunt truth
- Gold is not an "investment" — it's the measuring stick
- The dollar is not "stable" — it's the variable
- Most gains you see in markets — are currency illusion
What Collapses the Dow / Gold Ratio
This ratio doesn't fall gently — it breaks violently when confidence shifts. There are only three true triggers in modern history.
Trigger 1: Real rates go negative (and stay there)
When: interest rates < inflation, bonds guarantee loss. Capital must leave financial assets. Effect: gold accelerates, stocks stagnate or fall in real terms.
Trigger 2: Credit system stress
Examples: banking instability, liquidity freezes, sovereign debt scares. This is when "paper wealth" is questioned. Effect: gold spikes fast, stocks drop or lag badly.
Trigger 3: Policy panic — the big one
Central banks print aggressively, cap yields, monetise debt. This is the 1980-style move setup. Effect: gold goes vertical, Dow/Gold ratio compresses hard toward 1–5.
The Signals That Matter
Most indicators are noise. These are the ones that actually lead cycles.
Signal A: Gold vs real yields
Watch inflation-adjusted bond yields. If real yields trend downward, the gold trend is intact.
Signal B: Gold outperforming stocks
Just watch relative strength: if gold rises while stocks rise, that's an early warning. If gold rises while stocks fall, that's cycle confirmation.
Signal C: Central bank behaviour
Not what they say — what they do. Buying gold = loss of confidence in the system. Expanding balance sheets = liquidity injection.
Signal D: Volatility spikes plus policy response
Pattern: market stress, authorities intervene, liquidity floods system. Each cycle response is bigger than the last.
Signal E: Dow / Gold ratio trend
Your macro compass. Rising → financial asset dominance. Falling → hard asset dominance. Right now it's rolling over structurally.
Where we are right now (May 2026)
All signals aligned:
- Real yields unstable
- Gold at structural highs
- Central banks accumulating gold
- Debt levels extreme
- Markets dependent on liquidity
This is not early cycle anymore. This is transition toward hard-asset dominance.
What Likely Happens Next — The Sequence
Not exact timing — but the order of events matters.
Phase 1 (now → near-term)
Gold grinds higher. Stocks volatile, sideways in real terms. Policy remains reactive.
Phase 2 (trigger event)
Credit event / liquidity stress. Rapid policy easing. This is where gold accelerates sharply.
Phase 3 (blow-off / reset)
Gold goes vertical. Public piles in late. Dow/Gold compresses toward 3–5 (or lower).
Phase 4 (after reset)
Gold peaks. Stocks become generational cheap (in gold terms). This is where smart capital rotates back.
Portfolio Structure Aligned to the Cycle
Not generic advice — this is cycle positioning logic.
Core principle
We are not trying to "beat the market" — we are trying to stay ahead of monetary debasement.
Suggested structure (cycle-aware)
Gold / hard money — the core anchor
Physical gold (or equivalents). Role: preserve purchasing power and benefit from monetary stress.
Select equities — but selective
We focus on resource producers, energy, and real-asset-linked businesses. We avoid overvalued growth dependent on cheap liquidity.
Liquidity — but tactical
Cash is optionality. But long-term holding equals guaranteed erosion.
Optional layer (advanced)
Silver (higher beta to gold). Commodity exposure. Select asymmetric opportunities.
What we avoid (this cycle)
- Blind "buy the index" mentality
- Long-duration assets dependent on low rates
- Assuming housing always outperforms
- Holding excess cash long-term
The Real Timing Framework
Forget predictions — we use this.
- If Dow/Gold > 20 → favour stocks
- If Dow/Gold between 5–15 → transition phase (we are here)
- If Dow/Gold < 5 → prepare to rotate into equities
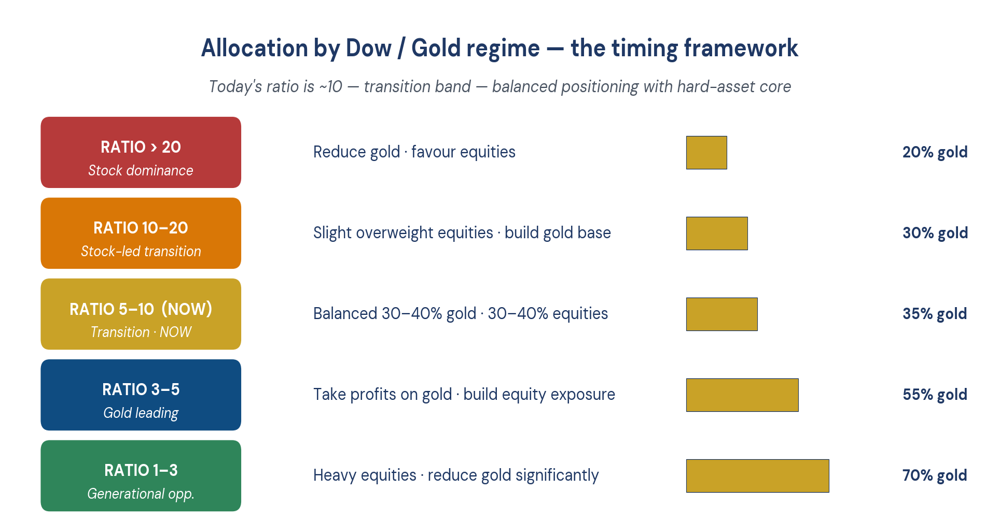 Figure 5. Allocation by Dow / Gold regime — the timing framework.
Final synthesis
This is the game: currency is weakening structurally. Financial assets had a 40-year tailwind. That tailwind is fading. Hard assets are taking leadership.
The blunt reality
- Most people will chase stocks late
- Then chase gold at the top
- Then miss the rotation back
The edge is understanding the cycle before it's obvious.
1970s versus Now — The Real Analog
Using the same anchor: the Dow Jones Industrial Average and gold.
Where it matches the 1970s
Monetary regime shift
1971: gold standard breaks. Today: fiat system under pressure (debt saturation). Both periods = loss of monetary anchor.
Inflation instability
1970s: inflation waves (not linear). Today: inflation sticky, episodic spikes. Not "high forever" — but structurally unstable.
Real yields under pressure
Then: deeply negative at times. Now: repeatedly trending negative. This is fuel for gold.
Commodities reasserting
1970s: oil, gold surge. Today: energy and metals tightening structurally.
Where it differs — and this matters more
Debt levels (the critical difference)
1970: low sovereign debt. Today: extreme global leverage. This limits central banks — they cannot tolerate high real rates.
Financialisation
1970s: economy-driven markets. Today: liquidity-driven markets. Asset prices depend on policy support.
Speed of response
Then: slow policy reaction. Now: instant liquidity injection. Cycles compress — moves become more violent.
Bottom line of the comparison
We are not repeating the 1970s. We are in a leveraged, accelerated version of it.
The Scenario Tree — How You Stay Ahead
There are only two real macro paths from here.
Scenario A: Inflationary persistence (most likely baseline)
What triggers it: ongoing deficits, monetary expansion, supply-side constraints.
What happens: gold trends steady then accelerating; stocks nominal up but real flat or down; housing stalls in real terms; currency gradual erosion.
Dow/Gold outcome: falls toward the 3–5 range. Our strategy: overweight gold and real assets, select equities only, avoid long-duration exposure.
Scenario B: Deflationary shock → policy panic
What triggers it: credit event, liquidity freeze, market crash.
Phase 1 (shock)
Stocks down sharply. Gold dips briefly (liquidity squeeze). Dollar up temporarily.
Phase 2 (response)
Massive stimulus. Rate cuts / QE / intervention.
Phase 3 (aftermath)
Gold explodes upward. Stocks recover but lag in real terms.
Dow/Gold outcome: fast compression toward 1–3. Strategy: hold core gold through volatility, add during panic, deploy liquidity AFTER intervention.
Allocation Model with Timing Bands
This is the part most people never get right.
Current regime (2026), Dow/Gold ≈ 10
You are in the transition phase.
Base allocation (right now)
- Gold / hard assets: 30–40% — core anchor, non-negotiable in this phase
- Equities: 30–40% — tilt toward energy / resources; avoid duration-heavy growth
- Liquidity (cash): 10–20% — tactical flexibility, dry powder for dislocations
- Optional: 10–20% — silver, commodities, asymmetric plays
Timing bands — this is the edge
- If Dow/Gold → 15+: reduce gold slightly, increase equities
- If Dow/Gold → 5–10 (NOW): balanced positioning, gradually increase hard assets
- If Dow/Gold → <5: start rotating — reduce gold, accumulate equities aggressively
- If Dow/Gold → ~1–3: generational opportunity — go heavy equities, reduce gold significantly
Execution rules
Rule 1: Never go all-in on one side
This is a rotation game, not a bet.
Rule 2: Think in ratios, not dollars
Dollar prices lie — ratios don't.
Rule 3: Expect volatility spikes
The move to gold dominance is not smooth.
Rule 4: Ignore narratives
Media will always be late. Policy will always react.
What Assets and Sectors Win in This Phase
We are in transition from financial assets to hard assets — mid-cycle in the Dow / Gold shift.
Tier 1 outperformers (core leadership)
These tend to lead early and persist.
Gold and gold producers
Physical gold = stability. Miners = leveraged upside. When gold rises steadily, miners often 2–5× outperform.
Energy (especially supply-constrained)
Oil, gas, uranium. Structural underinvestment globally. These benefit from inflation persistence and geopolitical fragmentation.
Broad commodities
Copper, industrial metals, agriculture (in inflation phases). Real asset scarcity becomes visible.
Tier 2 outperformers (selective)
Financials (but only early/mid phase)
Benefit from inflation initially. Then get hit by credit stress later. Tactical, not long-term holds.
Infrastructure / real asset businesses
Toll roads, pipelines, utilities. Strong when pricing power exists and inflation can be passed through.
Underperformers — this is where people get hurt
Long-duration growth (classic tech multiples)
Valuations depend on low rates. Vulnerable to real yield pressure.
Housing (real terms)
Nominal may rise. Real purchasing power stagnates.
Cash (long-term)
Guaranteed erosion. Only useful tactically.
The 24-Month Tactical Playbook
We break this into phases, not calendar guesses.
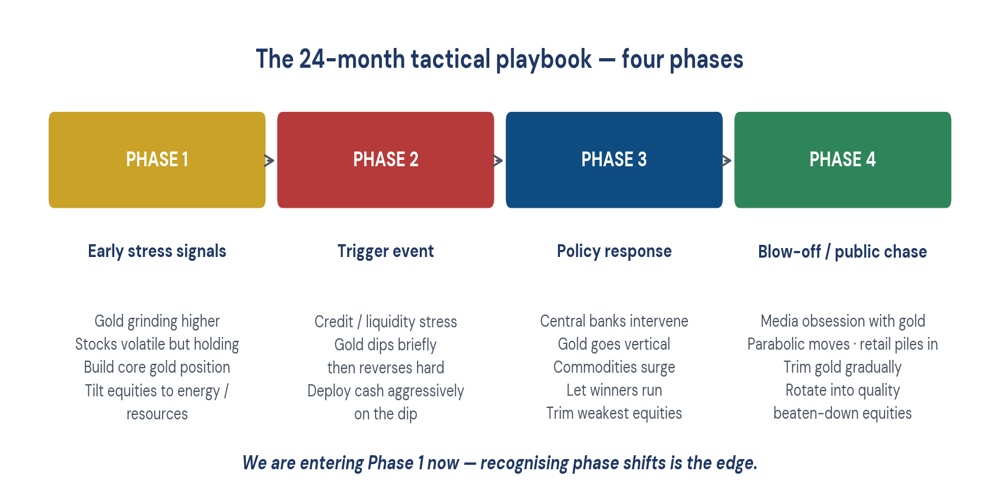 Figure 6. The 24-month tactical playbook — four phases.
Phase 1: Now → early stress signals
What you're seeing: gold grinding higher; stocks volatile but holding; policy still reactive.
Actions: build core gold position (if not already); tilt equities toward energy and resources; keep 15–20% liquidity.
Watch for: credit spreads widening; sudden volatility spikes; policy hesitation.
Phase 2: Trigger event — this is the opportunity
What it looks like: sharp equity drawdown; liquidity stress; fear spike. Market behaviour: gold may dip briefly (liquidity squeeze), then reverses HARD.
Actions: add to gold aggressively on dips; deploy liquidity into resource equities and quality assets under stress. This is where positioning is made.
Phase 3: Policy response → gold acceleration
What happens: central banks intervene; liquidity floods system. Market reaction: gold goes vertical, commodities surge, stocks recover but lag in real terms.
Actions: let winners run (don't overtrade); gradually reduce weakest equities; increase exposure to strongest trends (gold, energy).
Phase 4: Blow-off / public participation
This is where most people finally enter. Signals: media obsession with gold; retail chasing commodities; parabolic price moves. Dow/Gold likely approaching 3–5 (or lower).
Actions: start trimming gold gradually; rotate into high-quality equities and beaten-down sectors.
Tactical Indicators — Your Dashboard
Ignore noise — track these.
- Dow / Gold ratio — your primary compass
- Real yields — falling is bullish gold; rising is pressure on gold
- Liquidity (central bank balance sheets) — expanding = asset support; contracting = stress
- Volatility spikes — these signal opportunity, not danger
Example allocation evolution
NOW (ratio ~10)
Gold: 30–40%. Equities: 30–40% (tilted to real assets). Cash: 10–20%. Optional: 10–20%.
If crisis hits
Increase gold toward 40–50%. Deploy cash into weakness. Reduce weak equities.
If gold goes parabolic
Reduce gold toward 20–30%. Increase equities aggressively.
Final Clarity — This Is the Edge
This is not about predicting prices. It's about recognising phase shifts.
The sequence to remember
- Gold leads quietly
- Crisis hits
- Policy reacts
- Gold accelerates
- Public chases
- Rotation begins
The mistake most make
They wait for confirmation. By then, the move is mostly done.
The advantage we now have
We are not reacting to headlines. We are reading structure.
DISCLAIMER This newsletter is published for informational and educational purposes only. Nothing contained herein constitutes investment advice, a solicitation, or a recommendation to buy or sell any financial instrument. All investment involves risk, including the loss of principal. Past commentary does not guarantee future results. Any views expressed are those of the author as of the date of publication and are subject to change without notice. Please consult a licensed financial advisor before making any investment decisions. |