Equities Gold Housing
The Monetary Cycle Turns
Bull, Bear, Bust · 29 September 2026 · 7 min read
MONTHLY RESEARCH · MONETARY CYCLE
What We're Watching and Preparing For
Bull, Bear, Bust · The Monthly Macro Memo · May 2026
The Hidden Story Behind the Headlines
If you only read headlines, the world looks confusing. Stocks are near record highs. Gold keeps breaking records. Housing seems impossibly expensive. And yet, something deeper is happening beneath the surface — something most people miss entirely. We are not watching four separate markets. We are watching one system: a monetary cycle that rotates between trust in paper and trust in hard assets. This cycle has played out before. It is playing out now. And understanding where we are in it changes everything about how you see your money, your home, and your future.
KEY POINTS A quick-read snapshot of this newsletter's commentary
▸ We are not watching four separate markets — stocks, gold, housing, dollars. We are watching one system: a monetary cycle rotating between paper assets and hard money. ▸ The US dollar has lost ~88% of its purchasing power since 1970. Gold rose 135×. Gold didn't "skyrocket" — the dollar was repriced downward. ▸ Housing looks like a great investment in dollar terms (~18×) but only ~2× in real terms. Priced in gold, today's median US house (~130 oz) is cheaper than 1970's (~714 oz). ▸ The Dow / Gold ratio is our compass. 1970: 24:1. 2000 peak: 40:1. Today: ~10:1. The 40-year tailwind for financial assets is structurally fading. ▸ We are in a transition phase — real yields unstable, central banks accumulating gold, sovereign debt extreme. Today's leveraged version of the 1970s — central banks are trapped. ▸ Our framework: track the Dow/Gold ratio, real yields, and central-bank behaviour. Core position in physical gold, equities tilted to energy and resources, 10-20% liquidity. ▸ We expect four phases ahead — transition, trigger event, policy response, blow-off / rotate. Our edge is recognising phase shifts before they become obvious. ▸ We are not predicting. We are preparing. The cycle turns whether we are ready or not. We intend to be ready. |
The Dollar's Quiet Collapse
Since 1970, the US dollar has lost roughly 88% of its purchasing power. That is not a conspiracy theory — it is arithmetic. What $1 bought in 1970 now requires $8.50. Meanwhile, gold has risen from $35 to roughly $4,800 per ounce — a 135-fold increase. Here is the insight most people miss: gold did not "skyrocket." The dollar was repriced downward. This is not coincidence. It is monetary policy in action. Every time central banks expand money supply to manage debt, they are slowly eroding the value of the currency in your pocket. The dollar is not stable. It is the variable. Gold is the measuring stick.
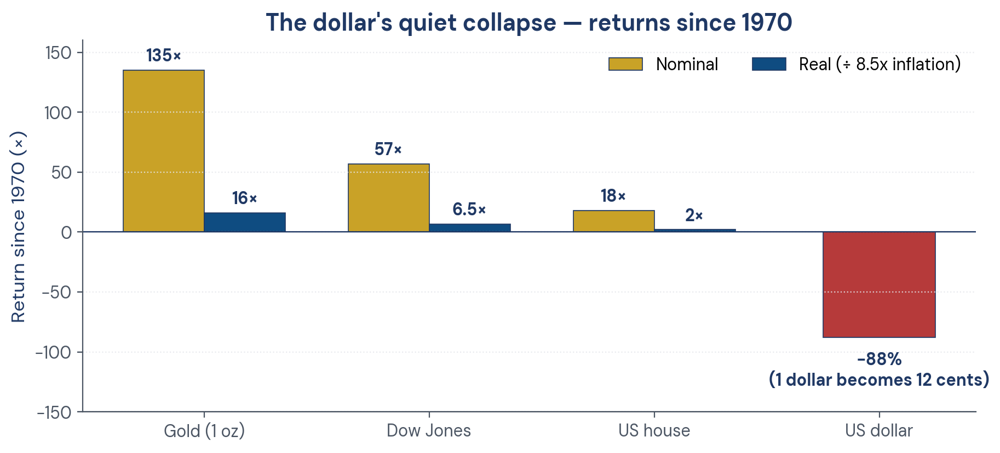 Figure 1. The dollar's quiet collapse — returns since 1970, nominal and inflation-adjusted.
Housing — The Illusion of Wealth
Your parents' home may have cost $25,000 in 1970. Today, the median US home runs $400,000 to $600,000. Sounds like a great investment — until you price it in gold. In 1970, a house cost about 714 ounces of gold. Today, it costs roughly 100 to 160 ounces. In dollar terms, housing looks like it soared. In gold terms, it got cheaper. Most "housing wealth" is not real wealth. It is leverage, inflation illusion, and credit expansion dressed up as appreciation. We do not view real estate as a generational store of value. We view it as an asset tied to credit cycles — and those cycles are turning.
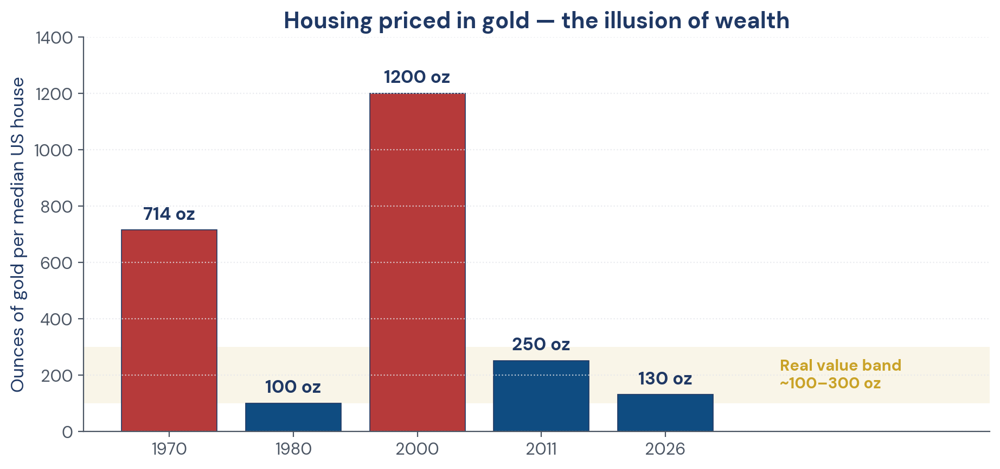 Figure 2. Housing priced in gold — oscillates in real terms, not 'going up'.
Stocks — The Forty-Year Tailwind Fades
The Dow Jones has risen from 839 in 1970 to roughly 48,000 today — a 57-fold gain in nominal terms. But adjust for inflation, and the real gain shrinks to about 6 or 7 times. More importantly, the ratio of the Dow to gold tells the real story. In 2000, it took 40 ounces of gold to buy the Dow. In 1980 and 2011, it took roughly 1 and 6 ounces respectively. Today, it sits around 10. That ratio is our compass. When it is high (20–40), financial assets dominate. When it falls (toward 1–5), hard money takes leadership. We believe that tailwind — the 40-year run where stocks consistently outperformed in real terms — is fading. Not ending tomorrow. But structurally fading.
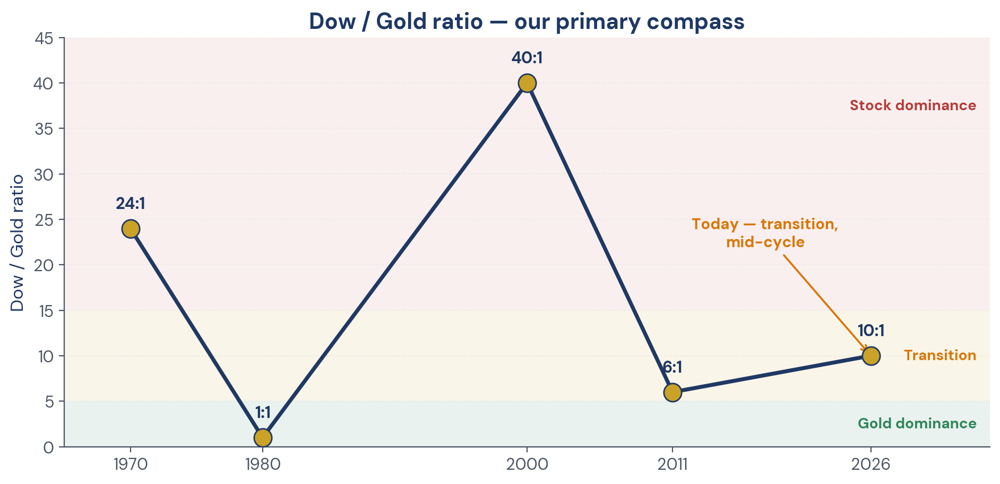 Figure 3. The Dow / Gold ratio — our primary compass across the cycle.
Where We Are Right Now
We are in a transition phase. Not the beginning. Not the end. The middle. Real yields are unstable. Central banks are accumulating gold at record pace — not talking about it, but actually buying it. Sovereign debt levels are extreme. And markets have become dependent on liquidity injections to function. These are not normal conditions. They are the symptoms of a leveraged, accelerated version of the 1970s monetary stress — but with one critical difference: today's global debt load means central banks cannot tolerate high real rates. They are trapped. And when policymakers are trapped, hard assets tend to win.
What We Are Doing — Our Roadmap
We are not making predictions. We are positioning for phases. Our framework is simple: we track the Dow-to-gold ratio as our primary compass, real yields as our fuel gauge, and central bank behavior as our confirmation signal. Right now, with the ratio near 10, we are building a core position in physical gold and gold-linked assets as our anchor. We are tilting our equity exposure toward real-economy sectors — energy, resources, and commodity producers — while reducing exposure to long-duration growth assets dependent on cheap money. We are holding 10–20% in liquidity not as an investment, but as optionality for the dislocations we expect ahead.
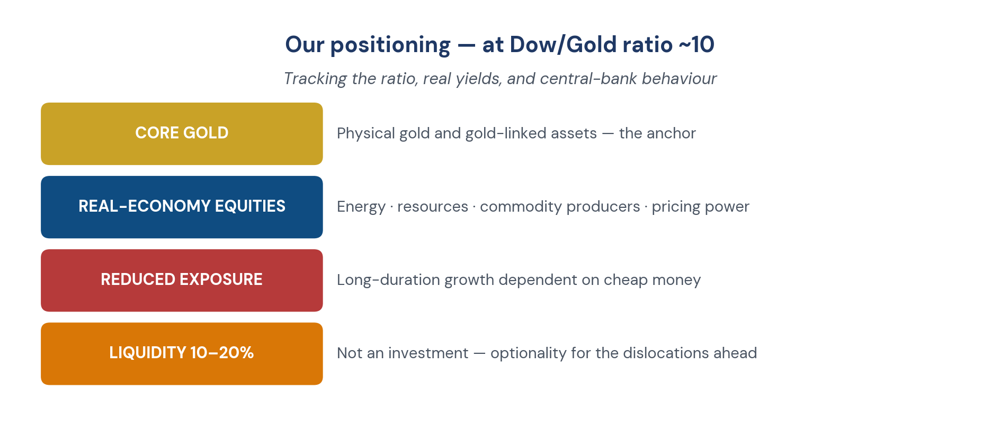 Figure 4. Our positioning today — at a Dow / Gold ratio near 10.
The Four Phases Ahead
We see the next few years unfolding in phases, not dates. Phase one — where we are now — features gold grinding higher while stocks remain volatile but hold. Phase two brings a trigger event: a credit stress, liquidity freeze, or policy panic that causes a sharp equity drawdown. Gold may dip briefly, then reverse hard. That is the opportunity. Phase three follows the inevitable policy response — rate cuts, QE, intervention — which sends gold vertical and commodities surging. Phase four is the blow-off: public participation, parabolic moves, and the Dow-to-gold ratio compressing toward 3 to 5. That is when we begin rotating back. Not before.
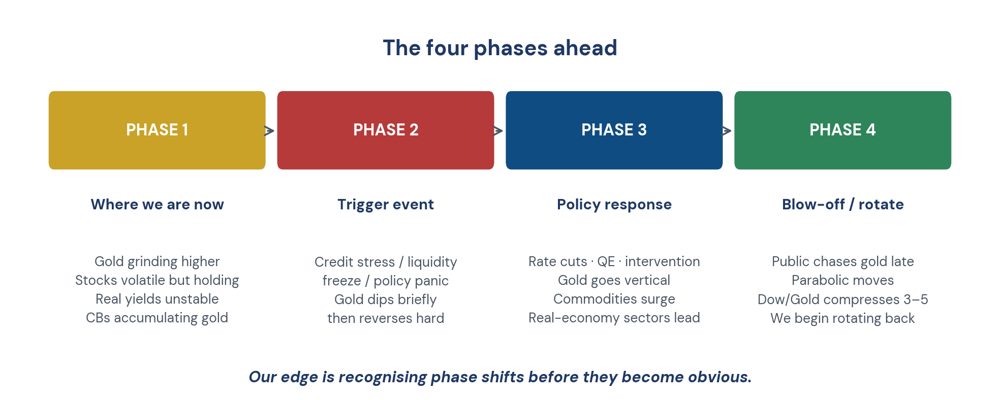 Figure 5. The four phases ahead — recognising shifts before they become obvious.
The Mindset That Matters
The mistake most people make is waiting for confirmation. By the time gold is on every magazine cover, the move is mostly done. By the time stocks look "cheap" again in dollar terms, they may be expensive in gold terms. We think in ratios, not dollars. Dollar prices lie — ratios do not. We expect volatility. We expect narratives to lag reality. We expect the media to be late, and policymakers to react bigger each cycle. Our edge is not prediction. It is recognizing phase shifts before they become obvious.
The Bigger Picture
This is not about fear. It is about structure. Currency weakens structurally. Financial assets had a four-decade tailwind from falling rates and expanding credit. That tailwind is fading. Hard assets are taking leadership. This transition only happens a few times per century. Our job is not to time the exact month or quarter. Our job is to stay aligned with the cycle: overweight hard money during the transition, deploy liquidity during stress, and rotate back into productive assets when the ratio signals generational value. We are preparing now — quietly, deliberately, and with our eyes on the structure beneath the noise. The cycle turns whether we are ready or not. We intend to be ready.
This newsletter reflects our current thinking and positioning. It is not financial advice. It is simply what we see, what we are doing, and what we are preparing for.
DISCLAIMER This newsletter is published for informational and educational purposes only. Nothing contained herein constitutes investment advice, a solicitation, or a recommendation to buy or sell any financial instrument. All investment involves risk, including the loss of principal. Past commentary does not guarantee future results. Any views expressed are those of the author as of the date of publication and are subject to change without notice. Please consult a licensed financial advisor before making any investment decisions. |