Macro United States China Japan
The Three-Year Race: USA, China, or Japan?
Japan Leads, China Waits, America Is Priced for Perfection
Bull, Bear, Bust · 1 June 2026 · 10 min read
Dear Client,
The question arrives almost as often as the one about AI trading. "Where should I put my money for the next three years? America? China? Japan?"
KEY POINTS A quick-read snapshot of this newsletter's commentary
▸ Japan is our top pick for the next three years. Oil exposure is better managed than the panic suggests, earnings are holding up, and the Tokyo Stock Exchange reforms are real. We see roughly 10 to 15 percent annualized returns. ▸ China is the long-term winner, but the timing is wrong. We expect the global risk-off trade to run further. We start buying if the CSI 300 falls below 4,600 and add aggressively below 4,200. ▸ The United States is the most expensive and the most vulnerable. The Shiller CAPE is about 37.5 against a long-run average of 17.3, and 59 percent of the S&P 500's value rests on growth beyond a steady-state economy. ▸ Goldman Sachs expects about 6.5 percent annualized S&P 500 returns over the next ten years, below its 7.7 percent forecast for global equities. ▸ We hold 40 percent cash, are short semiconductors, and are buying hated sectors selectively: financials, healthcare and software. ▸ We are not predicting a crash. We are preparing for a correction. |
It is the wrong question, of course. You know this. I know this. The right question is not "which market will go up the most?" but "which market offers the best risk-adjusted return given where we are in the cycle?" But clients ask, and we answer. So let us answer honestly.
After running the screens, reading the tea leaves, and arguing among ourselves, here is where we land.
Japan is our top pick for the next three years. China is the long-term hold, but the timing is wrong. The United States is the most expensive and the most vulnerable.
Let me walk you through the math and the madness.
Japan: The Surprising Winner
Yes, Japan. The market everyone forgot. The market that spent thirty years going nowhere. That market is now the most compelling opportunity among the three.
The Oil Shock Is Priced In
Japan is heavily dependent on Middle Eastern oil. Everyone knows this. The market has been punishing Japanese stocks accordingly. The Nikkei 225 surrendered all of its year-to-date gains by the end of March as the Iran war escalated.
But here is what the panic sellers are missing. Japan has enormous strategic reserves—approximately 470 million barrels of oil, one of the largest stockpiles in the world. The government has already begun releasing 80 million barrels, equivalent to roughly 45 days of domestic demand.
More importantly, Japan's oil intensity—the amount of oil required to generate each unit of GDP—is remarkably low. At roughly 0.25, Japan is significantly more efficient than China (0.33), South Korea (0.49), and India (0.51). This means Japan needs substantially less oil to grow. The structural efficiency is a powerful buffer that the market is currently ignoring.
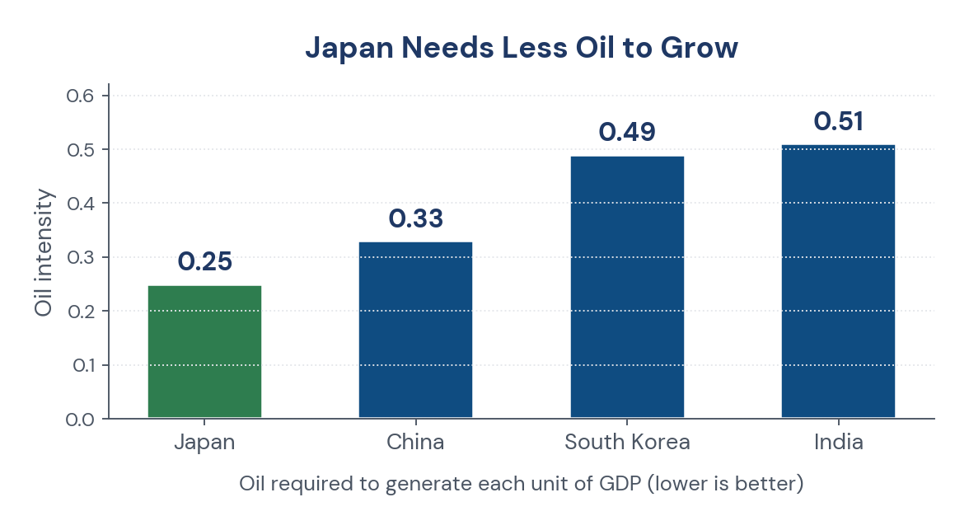
Figure 1. Oil intensity: the amount of oil required to generate each unit of GDP.
Corporate Earnings Are Holding Up
Despite the oil shock, Japanese companies are still delivering. Bank of America recently raised its year-end targets for both the Nikkei 225 and the TOPIX index after analyzing third-quarter results. The number of companies raising guidance reached the highest level in the past ten years, excluding the pandemic period.
Fifty-eight percent of TOPIX constituents delivered positive earnings surprises in the third quarter. Consensus forecasts still point to solid 13 percent and 10 percent earnings growth in fiscal 2026 and 2027, respectively.
Structural Reforms Are Real
The Tokyo Stock Exchange is forcing companies to care about shareholders. This is not a rumor. It is not a hope. It is regulation. Companies with price-to-book ratios below one are being required to submit plans for improvement. Share buybacks are rising. Dividends are increasing. Corporate governance is actually improving.
Bank of America notes that the market price-to-earnings ratio has risen to about 17 times, exceeding the previous ceiling, in line with improving return on equity. This "suggests the fundamental range for P/E multiples may have shifted upward". The last time this happened was 2013. That worked out well for investors.
The Numbers
Analysts at FSMOne project the Nikkei 225 could reach 61,600 by fiscal 2029, implying roughly 21 percent upside from current levels. Bank of America is even more bullish, raising its year-end 2026 target for the Nikkei to 61,000.
The base case for Japanese equities is not a moonshot. It is steady, grinding, compounding returns driven by real earnings growth and rising shareholder returns. That is exactly the kind of market we want to own.
What We Are Doing
We are already positioned in Japan. We own starter positions in Tokyo Electron, Disco Corporation, and Sumco Corporation. Semiconductor equipment and materials are Japan's greatest strengths, and AI demand continues to provide a tailwind regardless of who wins the broader technology war.
We will add to these positions on any meaningful pullback. We are not chasing. But we are accumulating.
China: The Long-Term Winner, Wrong Time
China is the most oversold major market on the planet. Bank of America has identified Chinese technology stocks as among the most oversold trades in the world. The technical indicators on the CSI 300 are flashing strong buy.
So why are we not buying?
The Valuation Case Is Compelling
Chinese technology stocks trade at prices that assume the end of growth, the end of capitalism, the end of everything. Alibaba trades at a single-digit price-to-earnings ratio. Tencent is not much higher. By almost any measure, Chinese equities are cheap relative to history and relative to the United States.
But the Timing Is Wrong
We believe the global risk-off trade has further to run. When the S&P 500 breaks below 5,000—and we believe it will—Chinese stocks will get dragged down with everything else. The correlation between global risk appetite and Chinese equities remains high. A panic in New York becomes a panic in Shanghai.
The Chinese economy is also struggling. The property crisis continues to drain household wealth. Consumer confidence is weak. Deflationary pressures persist. The government is stimulating, but the effects take time.
The Long View Has Not Changed
We remain convinced that China wins the semiconductor war over the next decade. Not because its technology is better. Because necessity is more powerful than choice. The Chinese government has unlimited patience and unlimited resources. American semiconductor companies have quarterly earnings reports.
When China builds its own complete semiconductor supply chain—and it will—the companies that survive will be worth many times what they trade for today. But that is a ten-year view. Not a three-year view.
What We Are Doing
We are neutral on China. The traffic light is yellow. We are watching the CSI 300. We have a shopping list ready. SMIC. NAURA. Alibaba. Tencent.
We will start buying when the CSI 300 falls below 4,600. We will add aggressively when it falls below 4,200. Until then, we sit on our hands.
United States: The Most Expensive and the Most Vulnerable
This is the hardest thing to write because America has been so good to investors for so long. But the math is the math.
Valuations Are Extreme
The Shiller CAPE Ratio sits at approximately 37.5. The historical average since 1871 is 17.3. The only time the CAPE was higher was during the dot-com bubble.
But the valuation problem is worse than the headline CAPE number suggests. Citigroup recently analyzed the valuation distribution across the entire S&P 500, not just the largest names. Their finding was striking.
At the 50th percentile of S&P 500 constituents—the median stock—the forward price-to-earnings ratio is 19.1 times, which sits at the 88th percentile of the past thirty years. At the 80th percentile, the ratio is 29.9 times, at the 89th percentile.
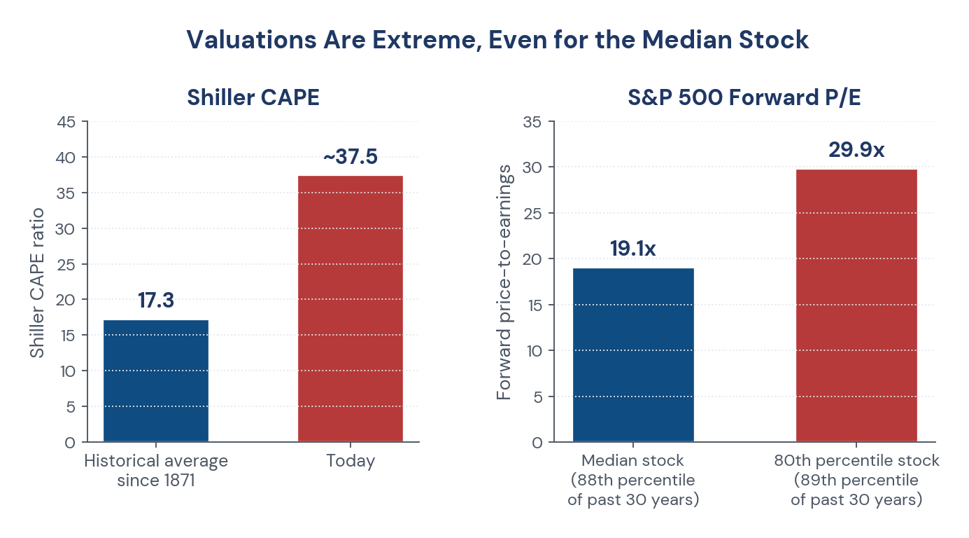
Figure 2. Shiller CAPE and S&P 500 forward price-to-earnings ratios (Citigroup).
The cheap stocks are not actually cheap. They are just less expensive than the expensive ones. The entire market has experienced valuation expansion. This is not a "Magnificent Seven" story. This is a broad market story.
The Growth Expectations Are Unrealistic
Citigroup's reverse discounted cash flow analysis reveals that the S&P 500 is pricing in five-year earnings per share growth of approximately 11.7 percent annually. Fifty-nine percent of the index's value is derived from expectations of future growth beyond a normal steady-state economy.
Here is the problem. That level of sustained earnings growth has almost never been achieved in the past forty years. The one exception was the peak of the dot-com bubble. We know how that story ended.
If the market delivers 6 percent earnings growth instead of 12 percent, the downside is substantial. There is no margin of safety when 59 percent of the price is based on a hope.
Earnings Growth Is Strong, But Is It Sustainable?
The Wall Street consensus for S&P 500 earnings growth sits at 21.8 percent for calendar 2026 and another 14.8 percent for 2027. Those numbers are achievable in the context of historical post-rate-cut cycles. Since the early 1980s, earnings growth has peaked 53, 76, 59, 44, 40, and 41 months after the Federal Reserve began cutting rates. The current cycle began in September 2024, so the peak could be as far out as 2028, 2029, or even 2030.
The numbers themselves are not impossible. But they are priced for perfection. And the valuations at which those earnings are being priced leave no room for error.
Goldman Sachs Agrees (Mildly)
Goldman Sachs expects the S&P 500 to deliver approximately 6.5 percent annualized returns over the next ten years. That is below their forecast of 7.7 percent for global equities and sits in the 27th percentile of returns since 1990.
The Goldman forecast includes a range of 3 percent to 10 percent annualized returns depending on the scenario. Their base case assumes 6 percent annualized earnings per share growth, a 1 percent annualized decline in valuations, and a 1.4 percent average dividend yield.
Even under Goldman's most optimistic scenario, the returns from American equities over the next decade are likely to be modest by historical standards. Under the pessimistic scenario, they are outright poor.
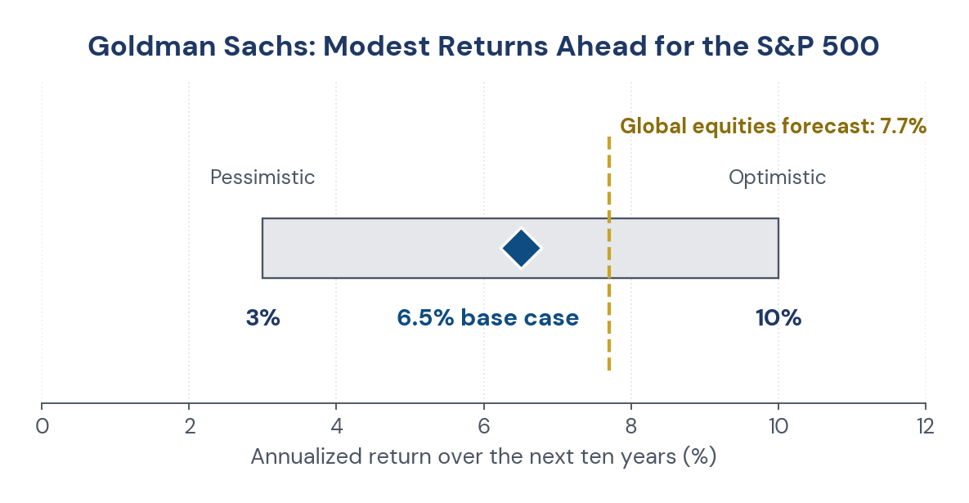
Figure 3. Goldman Sachs ten-year annualized return range for the S&P 500, against its global equities forecast.
What We Are Doing
We are bearish on the United States broadly. The traffic light is red for the overall market. We are short semiconductors through the ProShares Short Semiconductor ETF and a small tactical position in the triple-leveraged Direxion Daily Semiconductor Bear 3X Shares.
We are not abandoning America entirely. We are buying specific sectors that are hated and oversold—financials, healthcare, and software. But these are tactical positions, not strategic allocations.
Our cash position remains forty percent of total assets. That is higher than normal. That is intentional. We want dry powder for the day when the S&P 500 finally breaks its two-hundred-day moving average and the algorithmic selling begins.
The Three-Year Summary
Here is where we stand.
Japan is our top pick. The market has been punished for oil exposure that is better managed than the panic suggests. Earnings are holding up. Structural reforms are real. Valuations are reasonable. We see steady, compounding returns of roughly 10 to 15 percent annualized over the next three years.
China is the long-term winner, but the timing is wrong. The valuations are compelling. The strategic case is unshakeable. But the global risk-off trade has further to run. We will buy when the blood is in the streets. That moment is not yet here.
The United States is the most vulnerable. Valuations are extreme. Growth expectations are unrealistic. The entire market is priced for perfection, and perfection is rare. We are short the froth and selective in the value. But the broad market looks like a poor bet for the next three years.
[PASTE FIGURE HERE: scorecard.png]
Figure 4. The three-year scorecard: Japan, China and the United States.
The Bottom Line
We are not predicting a crash. We are preparing for a correction. The difference matters.
Our cash is dry powder. Our shorts are hedges. Our Japanese positions are long-term holds. Our Chinese watchlist is ready. Our American value picks are small and selective.
The next three years will not look like the last three years. The easy money has been made. The free lunch has been eaten. What remains is the hard work of picking winners in a market that no longer lifts all boats.
We are prepared for that work. We hope you are too.
DISCLAIMER This newsletter is published for informational and educational purposes only. Nothing contained herein constitutes investment advice, a solicitation, or a recommendation to buy or sell any financial instrument. All investment involves risk, including the loss of principal. Past commentary does not guarantee future results. Any views expressed are those of the author as of the date of publication and are subject to change without notice. Please consult a licensed financial advisor before making any investment decisions. |