Macro · Equities · United States
Global Market Roadmap: The Next 12 Months
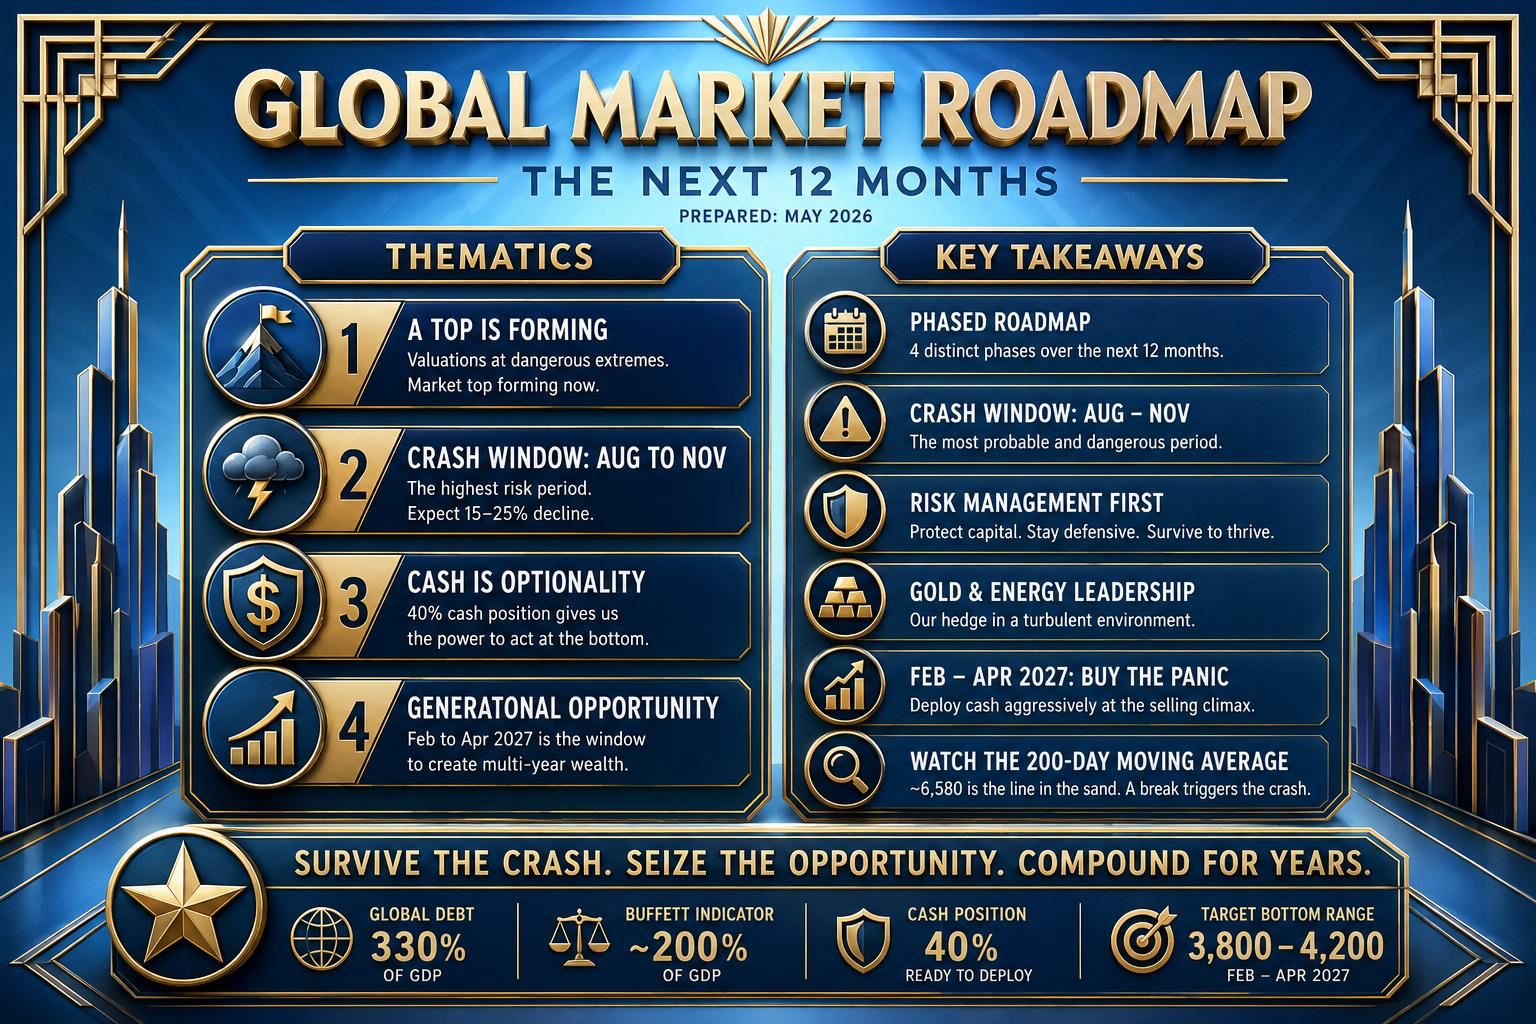
A Top Is Forming – The Crash Window Is August to November
Bull, Bear, Bust · 13 April 2025 · 13 min read
Dear Client,
This month's Macro Memo sets out our roadmap for the next twelve months. We believe a market top is forming now, and that the crash window opens in August and runs through November. We explain how we expect the year to unfold in four phases, how we are positioned in each asset class, and the weight of evidence behind our view.
KEY POINTS A quick-read snapshot of this newsletter's commentary
▸ A market top is forming now, and the crash window opens in August and extends through November. ▸ Global debt to GDP sits at historic peaks. Central banks cannot ease without reigniting inflation, and they cannot tighten without breaking something. ▸ The Buffett Indicator is at nearly two hundred percent of GDP, a level only seen before the three worst crashes of the past twenty five years. ▸ When debt is this high and valuations are this extreme simultaneously, the next significant market move is almost always a decline of twenty to forty percent. ▸ Phase 1, May to July 2026, is the Exhaustion Bounce. We hold forty percent cash and our short semiconductor positions, and we are not buying the dip. ▸ Phase 2, August to October 2026, is the Crash Window. We cut our equity allocation from roughly sixty percent to thirty percent and expect a decline of fifteen to twenty five percent. ▸ Phase 4, February to April 2027, is the Selling Climax Bottom. We expect the S&P 500 to bottom between 3,800 and 4,200, and we increase equities from thirty percent to eighty percent. ▸ Our weight of evidence is seventy percent on this path, twenty percent on an early crash and ten percent on a Fed driven extension of the bull market. The crash signal is a decisive close below the two hundred day moving average on the S&P 500, currently about 6,580. |
Executive Summary: A Top Is Forming – The Crash Window Is August to November
The weight of evidence has shifted decisively over the past thirty days. Three weeks ago, we wrote about a ceasefire bounce and a possible breadth thrust. That bounce has now run its course. The indicators we trust most are flashing the same warning signal: a market top is forming now, and the crash window opens in August and extends through November.
Let me be direct. We are not predicting. We are observing. And what we observe is a market that has climbed a wall of worry for eighteen months, driven by five stocks and a dream. The dream is fading. The wall is crumbling. The fall from this height will be painful.
Two structural dangers have moved from the background to the foreground. First, global debt to GDP sits at historic peaks. Central banks cannot ease without reigniting inflation, and they cannot tighten without breaking something. They are trapped, and the market knows it. Second, the Buffett Indicator – total market cap to global GDP – is flashing red at levels only seen before the 2000 dot com crash, the 2008 financial crisis, and the 2022 bear market. Valuations are not just high. They are dangerous.
[PASTE FIGURE HERE: Figure 1 - The Buffett Indicator and global debt to GDP.png]
Figure 1. The Buffett Indicator and global debt to GDP.
BBB's internal models show that when debt is this high and valuations are this extreme simultaneously, the next significant market move is almost always a decline of twenty to forty percent. Not a gentle correction. A crash. The only question is timing. Our models point to August as the month when the first domino falls.
Therefore, this roadmap has no fence sitting. We are telling you exactly what we see, month by month, and exactly how we are positioning. We do not recommend. We do not advise. We share our view, clearly and without ambiguity.
The Core Macro Backdrop – Why This Top Is Different
The war with Iran created a genuine supply shock when the Strait of Hormuz closed. Oil prices spiked. A ceasefire has reduced immediate panic, but flows have not normalised. Energy remains the only sector with genuine leadership, and even that leadership is showing signs of exhaustion.
Central banks are stuck. Inflation is rising because of energy and supply chains, but growth is slowing because of the same war. The Federal Reserve will not cut rates until late 2026 at the earliest, and by then it will be too late. Do not expect help. The cavalry is not coming.
The BBB indicators we watch most closely – breadth, sentiment, and our bond commodity composite – have all turned bearish over the past two weeks. Fewer stocks are participating in the rally. Sentiment has shifted from fear to complacency. The bond market is whispering what the stock market is shouting: a top is in.
The 12 Month Roadmap – Month by Month
We have broken the year into four distinct phases. There is no ambiguity. We are telling you exactly what we expect and exactly how we are positioned.
[PASTE FIGURE HERE: Figure 2 - The roadmap in four phases, and where we stand today.png]
Figure 2. The roadmap in four phases, and where we stand today.
Phase 1: May 2026 – July 2026 – "The Exhaustion Bounce"
Our expectation: The market will chop sideways to slightly higher over these three months, but the character will change. The easy money has been made. Volume will dry up on up days. Leadership will narrow to Energy, Healthcare, and Consumer Staples. Technology will lag. Financials will be choppy. The rally will feel unconvincing because it is unconvincing.
What we are doing: We are maintaining our forty percent cash position. We are holding our short semiconductor positions through the ProShares Short Semiconductor ETF. We are adding to our Japanese semiconductor equipment names slowly, on pullbacks. We are not chasing anything. We are not buying the dip. We are waiting.
What we are absolutely not doing: We are not buying mega cap Technology. We are not adding leverage. We are not interpreting this sideways action as an all clear signal. It is the opposite. It is the calm before the storm.
Phase 2: August 2026 – October 2026 – "The Crash Window"
Our expectation: This is the most important quarter of the next twelve months. The top will complete in early August. The crash will begin by mid August and accelerate through October. The triggers will be one or more of the following: a breakdown below the 200 day moving average on rising volume, a spike in the VIX above thirty five, a credit event in private markets, or an escalation of the Iran conflict. We do not know which trigger will fire. We know that one of them will.
The bearish signals we are watching: Breadth will fail. Less than forty percent of stocks will trade above their fifty day moving averages. The fifty day moving average will cross below the two hundred day moving average on major indices – the Death Cross. Credit spreads will widen sharply. The put call ratio will spike. Margin calls will go out.
What this means: The war impact has permanently damaged growth. Inflation is now entrenched. Recession probability jumps above fifty percent. The market will finally recognise what the bond market has been saying for months.
What we are doing: We will cut our equity allocation from roughly sixty percent to thirty percent. We will move twenty percent into short term bonds and increase our cash position to forty percent. We will add to our short positions in semiconductors and consider shorting the broader market through the ProShares Short S&P 500 ETF. We will not try to pick a bottom. We will not catch falling knives.
The risk: We expect a decline of fifteen to twenty five percent from August to October, with most damage in growth stocks. Semiconductors will be cut in half from their peaks. The Nasdaq will bear the brunt of the selling.
Phase 3: November 2026 – January 2027 – "The First Leg Down Completes"
Our expectation: By November, the panic will be exhausted – temporarily. The market will attempt a relief rally. It will fail. The downtrend will reassert itself. This is not the bottom. This is not even close to the bottom.
What we are doing: We will maintain our thirty percent equity allocation, concentrated in Energy (oil prices will remain elevated due to supply disruptions) and gold miners (gold will benefit from the flight to safety). We will hold forty percent cash and twenty percent short term bonds. We will not add to our short positions because the easiest money has already been made. But we will not cover either. The trend is down. We are staying with the trend.
What we are watching: Credit spreads will be at crisis levels. Our bond composite will be signalling full defence. The VIX will remain elevated, spiking on any news. This is not a market for heroes. It is a market for survivors.
Phase 4: February 2027 – April 2027 – "The Selling Climax Bottom"
Our expectation: This is where fortunes will be made. The market will make its final low sometime between February and April. The low will be accompanied by capitulation volume – a spike in selling that finally exhausts itself. Sentiment will be at double pessimism. Investors will swear they are never buying another stock again. That is our signal.
What we are doing: We will aggressively re enter. We will increase our equity allocation from thirty percent to eighty percent over February and March. We will focus on high quality growth stocks with strong balance sheets – the CANSLIM leaders that were unfairly sold off in the panic. We will buy breakaway gaps on volume. We will deploy our forty percent cash position. This is the generational buying opportunity that the dangerous debt and valuation levels have set up.
What we will feel: We will feel terrified. That is the signal. When everyone else is selling in a panic, we will be buying. Not because we are brave. Because our process tells us that the point of maximum financial opportunity is always the point of maximum pessimism. Livermore taught us that. Graham taught us that. Dreman taught us that. We are listening.
The target: We expect the S&P 500 to bottom between 3,800 and 4,200, approximately thirty percent below the recent highs. From that bottom, we expect a multi year recovery. But that is a story for another newsletter.
[PASTE FIGURE HERE: Figure 3 - Our planned equity allocation in each phase.png]
Figure 3. Our planned equity allocation in each phase.
Asset Class Direction – No Ambiguity
US Equities (S&P 500): Net bearish over twelve months. The top is forming now. The crash window is August to November. The Buffett Indicator is at nearly two hundred percent of GDP – a level only seen before the three worst crashes of the past twenty five years. We are not positioned for upside. We are positioned to survive the drawdown and deploy cash at the bottom.
Non US Equities (Japan, Europe, Emerging Markets): Net bearish in the short term, but less bearish than the United States. Japan is our preferred market for the recovery. The Tokyo Stock Exchange reforms are real. The valuations are reasonable. The companies are high quality. We are holding our Japanese semiconductor equipment positions through the downturn and will add aggressively at the bottom.
Commodities (Energy, Gold, Industrial Metals): Bullish for the next six to nine months. Oil stays elevated as long as Hormuz flows are impaired. Gold benefits from a weaker dollar and central bank buying. This is our hedge against the crash. When everything else falls, gold will hold.
Fixed Income (Bonds): Neutral to slightly bullish, but only for short term, high quality bonds. Long duration bonds are dangerous – if inflation stays sticky, yields will rise and long bonds will fall ten to fifteen percent. We are holding short term Treasuries and municipal bonds. We are not reaching for yield.
Cash: Our most important asset. In a crash, cash is optionality. It lets us buy the panic in February through April. We are holding forty percent cash. We will deploy it when the blood is in the streets.
[PASTE FIGURE HERE: Figure 4 - Our direction for each asset class.png]
Figure 4. Our direction for each asset class.
The Most Probable Single Scenario – BBB's Weight of Evidence
Probability: Seventy percent
The path:
- May to July: A choppy, narrow topping process. The S&P 500 makes a final, unconvincing high. Volume dries up. Leadership narrows to Energy and Defensives. The market feels tired because it is tired.
- August to October: The crash window opens. A breakdown below the two hundred day moving average triggers algorithmic selling. The VIX spikes above thirty five. Margin calls go out. The S&P 500 falls fifteen to twenty percent. Semiconductors fall thirty to forty percent.
- November to January: A relief rally fails. The downtrend reasserts itself. The S&P 500 tests the October lows and breaks them. Sentiment turns from fear to despair.
- February to April 2027: The selling climax. Capitulation volume. The S&P 500 bottoms between 3,800 and 4,200. We deploy our cash. The generational buying opportunity arrives. Our target return in this scenario: We will lose money on our equity positions in the crash – that is unavoidable. But our shorts will offset those losses. Our cash will let us buy at the bottom. Our gold will hold its value. By the end of the twelve months, we expect to be roughly flat while the market is down twenty percent. That is outperformance. That is survival.
The Primary Risk to This Scenario
Probability: Twenty percent
The Iran war escalates significantly in May or June. Hormuz is closed permanently. Oil spikes to one hundred and fifty dollars. The crash comes early – in July instead of August. The S&P 500 declines thirty percent by October. Our shorts will perform well, but our Japanese positions will suffer. We will survive, but the timing will be off.
The Secondary Risk
Probability: Ten percent
The Federal Reserve is forced to cut rates aggressively in late 2026 due to a sharper than expected slowdown. This reflates asset prices and extends the bull market into 2027. The dangerous debt and valuations become a 2028 problem, not a 2027 problem. We will underperform a simple buy and hold strategy by five to ten percent because we de risked too early. We will accept that risk. The probability is low. The debt and valuation numbers do not lie.
[PASTE FIGURE HERE: Figure 5 - The weight of evidence across the three scenarios.png]
Figure 5. The weight of evidence across the three scenarios.
Final Instruction
You have three jobs over the next twelve months.
First, watch the two hundred day moving average on the S&P 500. It is currently at approximately 6,580. A decisive close below this level on rising volume is the crash signal. Do not hesitate. Do not hope. Act.
Second, act decisively in Phase 4 regardless of the path. If we are at new highs by February 2027, we will have misread the cycle. That is unlikely. But if it happens, we will sell. If we are down thirty percent by February 2027, we will buy. Hesitation costs ten to fifteen percent in either direction.
Third, never forget the debt and valuation backdrop. The Buffett Indicator is at nearly two hundred percent of GDP. Global debt is at three hundred and thirty percent of GDP. These numbers do not go away. They are the reason we are bearish. They are the reason we are holding cash. They are the reason the crash is coming.
This roadmap will be reviewed monthly. The next scheduled review is June 1, 2026, when we will reassess the ceasefire, the two hundred day moving average, and our sentiment composites.
The top is forming now. The crash window is August to November. We are positioned. We are ready. We are waiting.
Sincerely,
Bull Bear Bust
DISCLAIMER This newsletter is published for informational and educational purposes only. Nothing contained herein constitutes investment advice, a solicitation, or a recommendation to buy or sell any financial instrument. All investment involves risk, including the loss of principal. Past commentary does not guarantee future results. Any views expressed are those of the author as of the date of publication and are subject to change without notice. Please consult a licensed financial advisor before making any investment decisions. |