Macro · Equities · United States
The Two-Month Report: Where We Stand After the Iran Shock
Caution Remains the Better Part of Valor
Bull, Bear, Bust · 10 October 2025 · 9 min read
Dear Client,
Two months ago, the world changed. American and Israeli forces launched airstrikes against Iran, and the comfortable market narrative of soft landings and immaculate disinflation evaporated overnight. We have now had enough time to see the patterns, measure the damage, and adjust our sails accordingly. This is where we stand.
KEY POINTS A quick-read snapshot of this newsletter's commentary
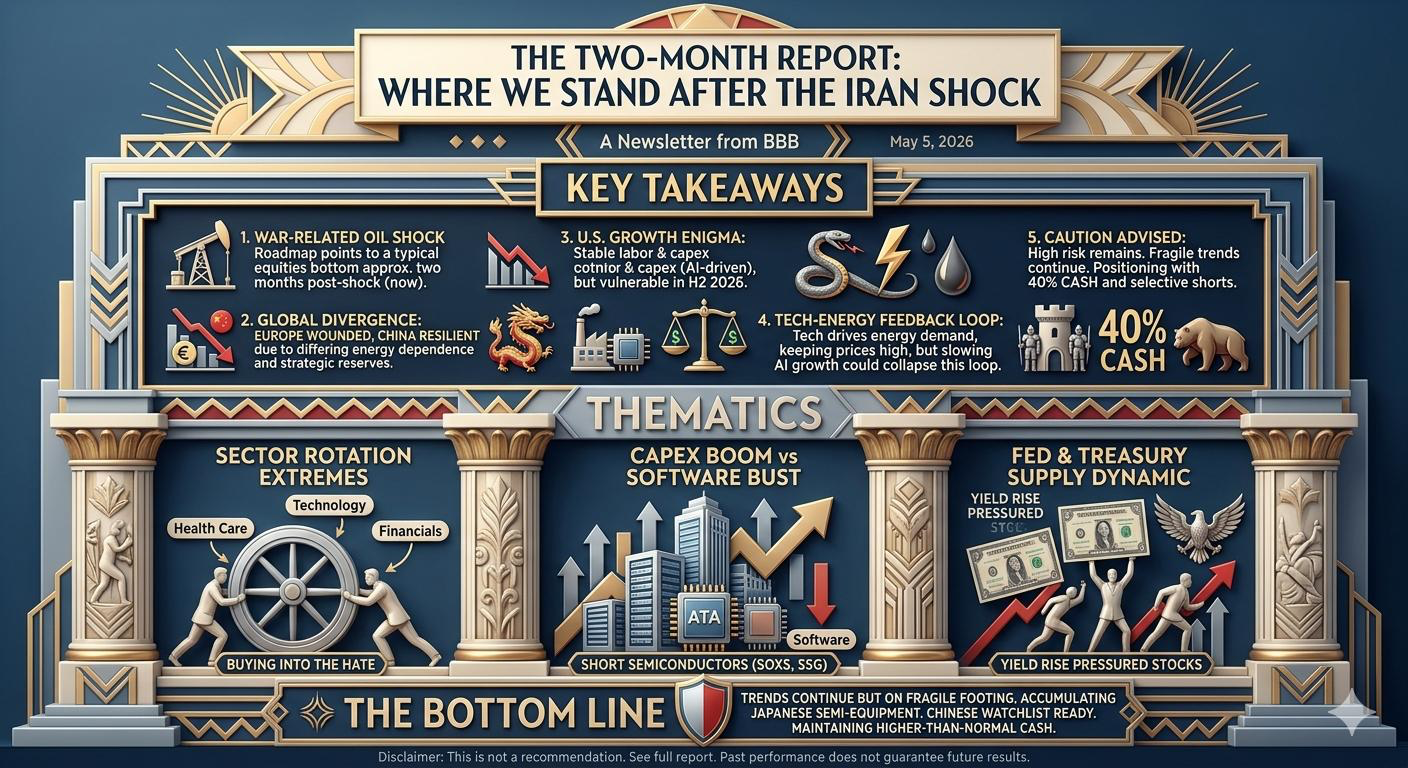
▸ Equities tend to bottom about two months after a war-related oil shock, and we are now at that two-month mark. The market has recovered from the March lows, but the trends that began with the attack continue on increasingly fragile footing. ▸ Europe has been hammered by the energy shock, while China has shown surprising resilience. ▸ US real GDP grew 2 percent annualized in the first quarter, driven almost entirely by AI-related capital expenditures. Our base case is 1.75 to 2.25 percent growth for the full year. ▸ Higher Treasury supply to fund defense spending pushes yields up even as the Federal Reserve cuts rates, a treacherous environment for stocks and bonds. ▸ Technology and energy are locked in a feedback loop, and Microsoft's cloud growth is the canary in the coal mine. ▸ The sector rotation has gone extreme: Health Care is at its lowest index weight since 1994 and Financials at its lowest since 2009. We are buying into the hate. ▸ We hold forty percent cash, and our semiconductor shorts remain in place. ▸ We are not predicting either outcome. We are preparing for both. |
The historical data on war-related oil price shocks offers a clear roadmap. Equities tend to bottom approximately two months after the initial shock. We are now at that two-month mark. The market has staged a recovery from the March lows, led by the same technology and energy names that dominated before the conflict began. But the question that haunts every trading desk from New York to Tokyo is whether this recovery is the beginning of a new leg higher or the setup for a second, more vicious decline.
Our answer, consistent with everything we have written over the past two months, is that caution remains the better part of valor. We are not bears. We are realists. And the reality is that the trends that began with the attack are continuing, but they are doing so on increasingly fragile footing.
The Global Divergence: Europe Bleeds, China Endures
The divergence we flagged in our March G7 and BIC outlook has played out exactly as we expected. Europe has been hammered. Eurozone purchasing managers indexes are at historic recession levels. German business confidence has collapsed. The continent is heavily dependent on Middle Eastern energy, and the supply shock has hit harder and faster than almost anyone predicted.
China, by contrast, has shown surprising resilience. The purchasing managers indexes released late last week revealed strength in manufacturing and exports that caught most economists off guard. China's energy efficiency and strategic reserves have provided a buffer that Europe lacks. This divergence is not temporary. It reflects structural differences in energy dependence, fiscal capacity, and policy flexibility. Europe will struggle for the rest of this year. China will muddle through. We are watching both closely, but we are only prepared to act on one.
The American Exception: Growth Holds, For Now
The United States occupies a strange middle ground. Real GDP grew at a robust 2 percent annualized rate in the first quarter, driven almost entirely by artificial intelligence-related capital expenditures. The consumer has softened under the weight of rising inflation, but there is no evidence of significant demand destruction yet. Labor markets remain stable. None of the indicators on our internal recession watch list have flipped.
But the second half of the year is more vulnerable. Real income growth is trending downward, squeezed by energy-driven inflation. The consumer can only run on fumes for so long. We are watching the April payrolls report this week as the single most important data point on the calendar. A strong number keeps the soft landing narrative alive. A weak number suggests the consumer is finally breaking. Our base case is slowing but not collapsing growth, roughly 1.75 to 2.25 percent for the full year. That is not a recession. It is also not a boom.
 and our full-year base case.](https://bullbearbust-campaign-media.s3.ap-southeast-2.amazonaws.com/newsletter-images/ef1b33e4-f9e2-4212-baa6-5a435704b56e.png) Figure 1. First-quarter growth (annualized) and our full-year base case.
The Fed and the Treasury Supply Problem
The war has created a hidden dynamic that most market commentators are missing. Defense spending is rising. The geopolitical risk premium is real. And the Treasury will need to issue more debt to fund it all. Higher supply of Treasurys puts upward pressure on yields, even if the Federal Reserve is cutting rates. This is the opposite of the normal relationship, and it creates a treacherous environment for both stocks and bonds.
We have already seen the dance. When bond yields rose after the attack, stock prices fell. When a temporary cease-fire was announced, both reversed. The correlation between rising yields and falling stocks is back, and it is punishing. The next phase of the war will determine whether that correlation continues or breaks. We are watching the chart daily, and we are positioned accordingly.
The Tech and Energy Feedback Loop
The most important structural development of the past two months is the tightening feedback loop between technology and energy. Big Tech is driving enormous demand for energy. Data centers are power-hungry. Artificial intelligence is power-hungry. The companies building the AI future are also the companies driving the energy demand that keeps oil prices elevated.
This creates a strange co-dependence. Tech stocks rise on AI enthusiasm, which validates massive capital expenditures, which drives energy demand, which keeps oil prices high, which benefits energy stocks, which supports the broader market. But the loop can also work in reverse. If AI growth slows, the capex cycle turns, energy demand softens, oil prices fall, energy stocks drop, and the whole house of cards collapses. We are watching Microsoft's cloud growth as the canary in this particular coal mine. Super-high capital expenditures are only justified by super-high and accelerating AI revenue growth. Microsoft does not have that. Neither do most of its peers.
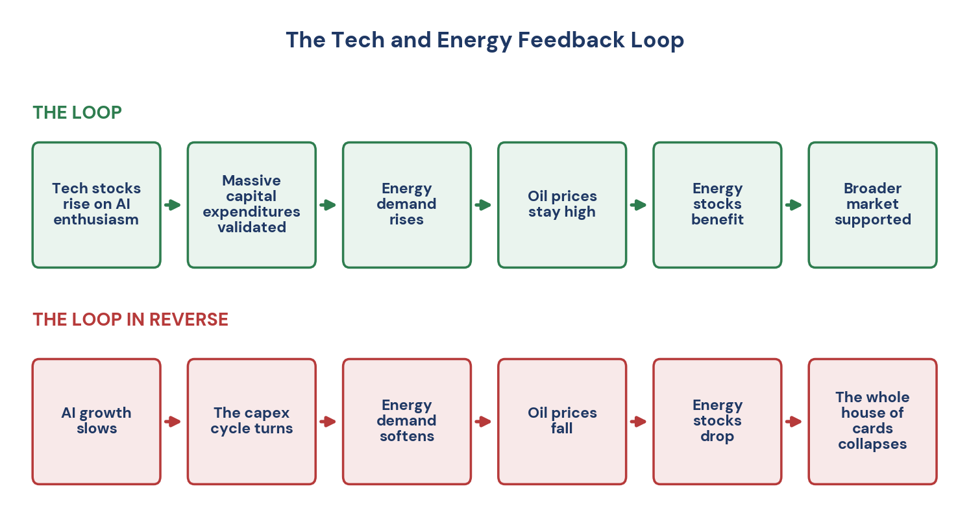 Figure 2. The tech and energy feedback loop, and the loop in reverse.
The Capex Boom and the Software Bust
Nonresidential fixed investment grew at a stunning 10.5 percent annualized rate in the first quarter. Equipment investment and intellectual property products grew even faster. The capex boom is real. But it is narrow. Big Tech's combined capital expenditure guidance for 2026 was raised from roughly $665 billion to $710 billion. That sum is almost impossible to comprehend. And it has all flowed to semiconductors, data center construction, and energy infrastructure.
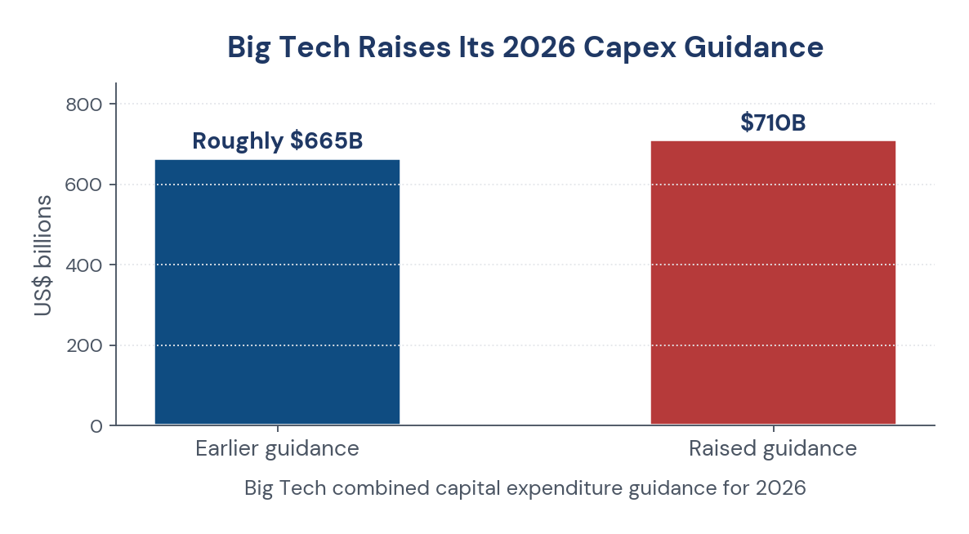 Figure 3. Big Tech combined capital expenditure guidance for 2026.
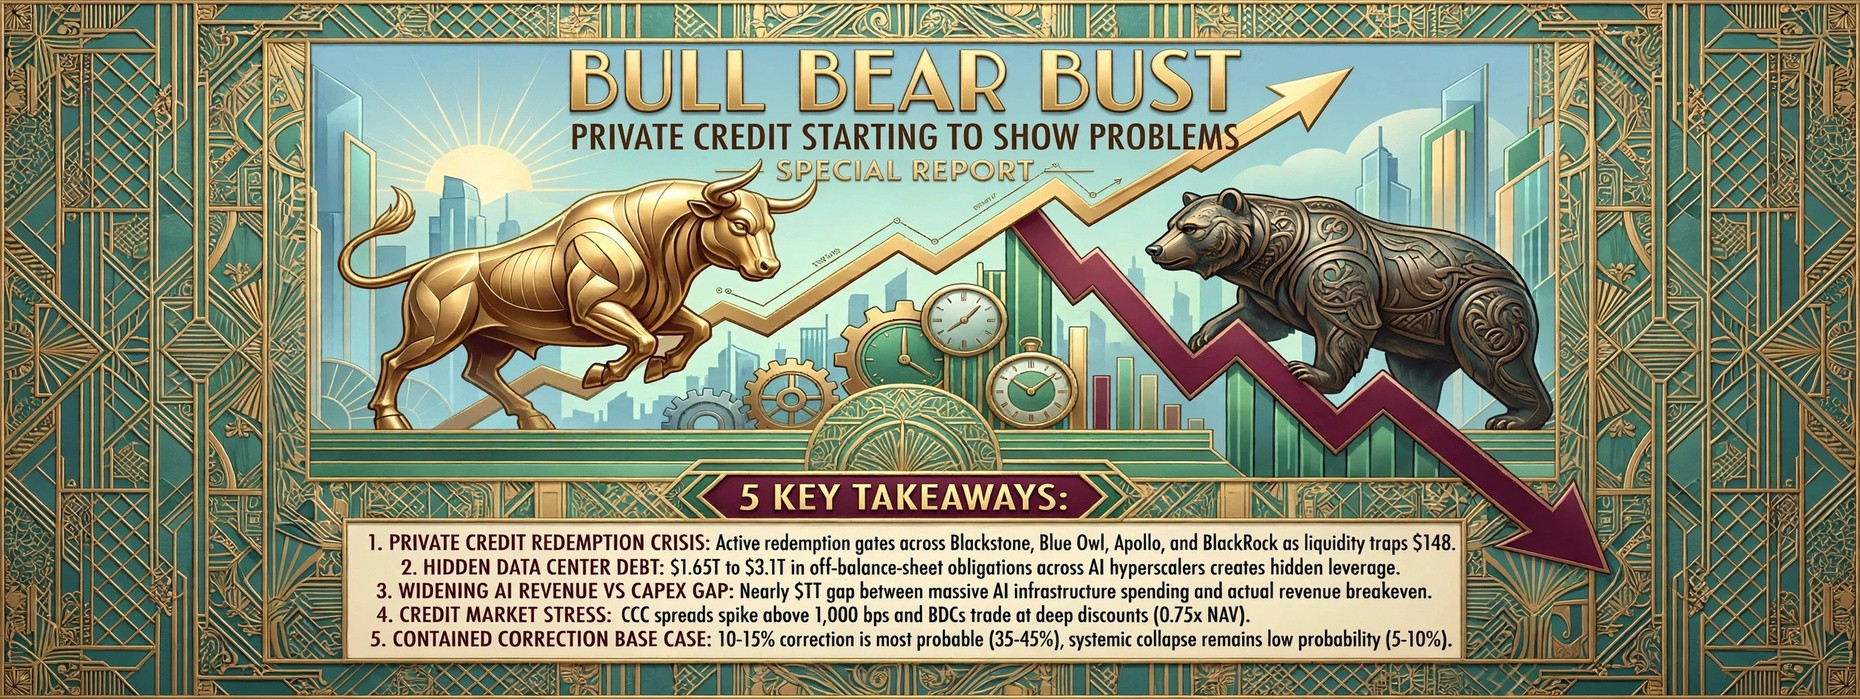
Software, meanwhile, continues to lag. Even Microsoft, the supposed leader in enterprise AI, is seeing disappointing cloud growth. The pattern is uncomfortably similar to 2022. Hardware spending leads. Software spending follows. But if software spending does not pick up broadly after the hardware and data center spending cools, the entire tech trade could collapse. We are not predicting that collapse. We are preparing for it. Our short positions in semiconductors through the ProShares Short Semiconductor ETF and our tactical position in the triple-leveraged bearish semiconductor ETF remain in place.
The Sector Rotation Has Gone Extreme
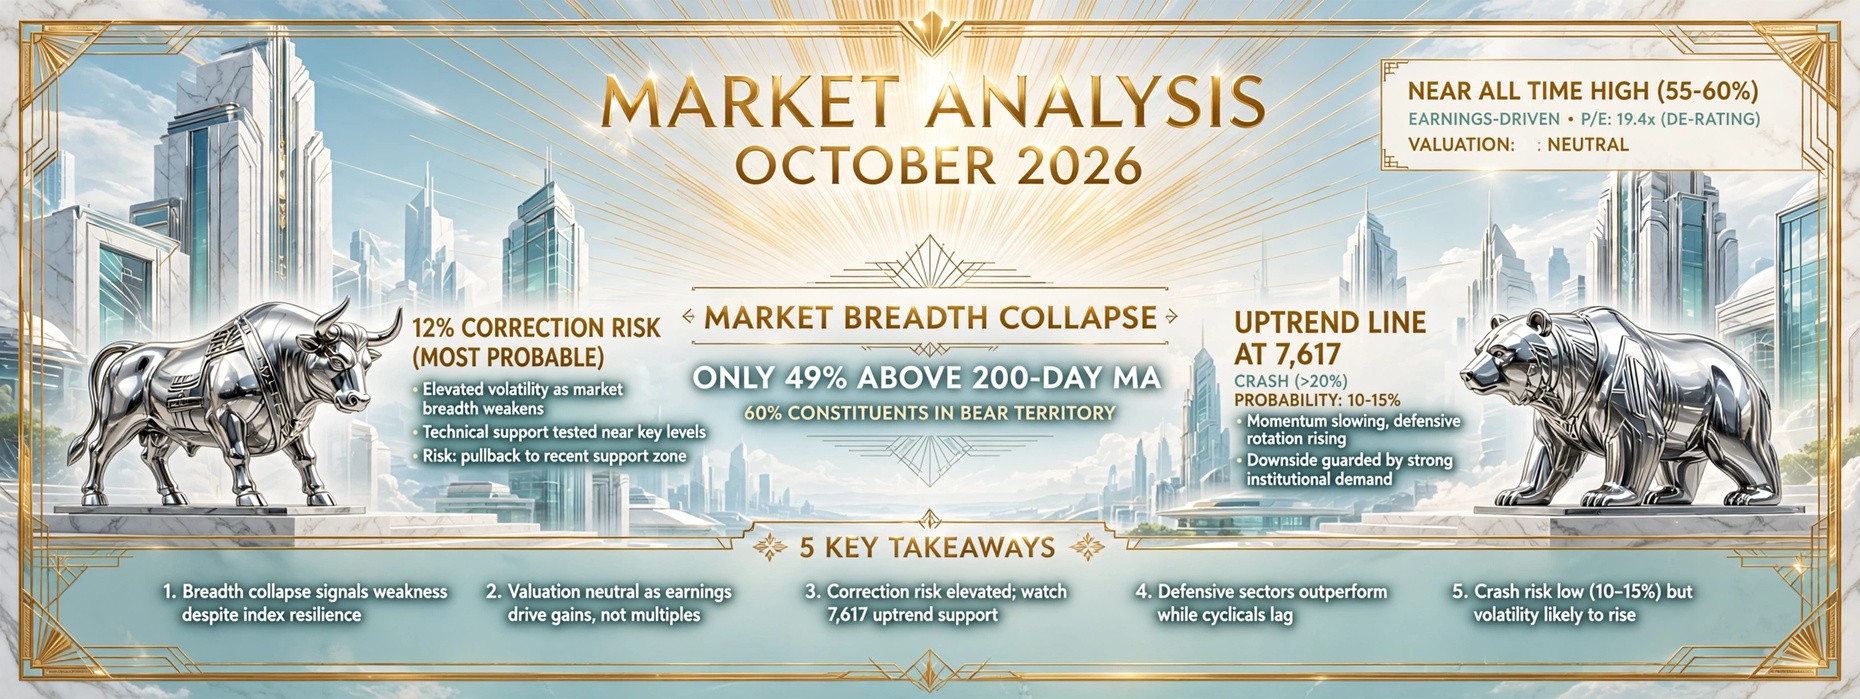
The sector rotation since the attack has been violent and, we believe, overdone. Technology finished April less than one percentage point away from its record high allocation in the S&P 500. Health Care finished April at its lowest weight in the index since 1994. Financials finished at its lowest weight since 2009. The extremes are breathtaking.
The earnings support for technology has been real. The beat rates and revision trends in tech are the best among all sectors. But the price trends look stretched and vulnerable. If a peace deal emerges, or even a credible cease-fire, lower energy costs would reduce inflation pressure. That outcome would support a rotation into value sectors outside of energy. Financials and health care, hated and oversold, would be the primary beneficiaries. We are positioned for that rotation. We own small positions in KKR and Hims & Hers Health. We are watching American Express and Molina Healthcare. We are not waiting for the turn. We are buying into the hate.
The Asset Allocation Puzzle
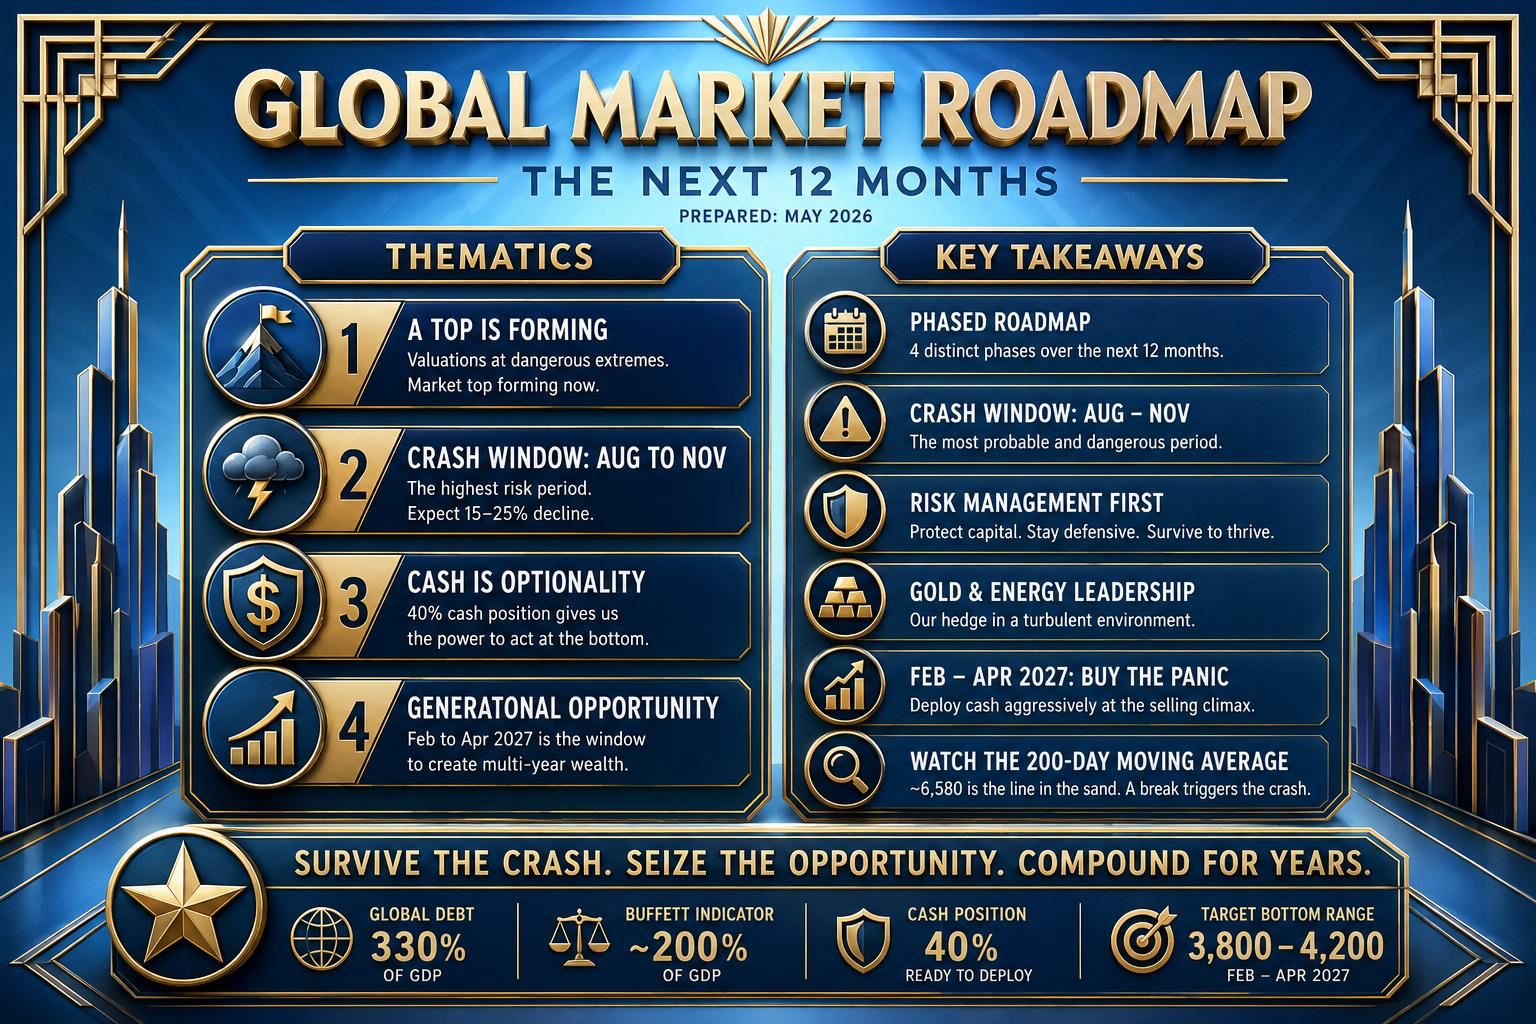
Our internal U.S. asset allocation model has shifted back to its maximum equity allocation of 70 percent. The shift was driven by trend-based indicators flipping back to stocks and economic indicators reflecting reduced recession risks. The model is mechanical. It does not have a geopolitical overlay. We respect it, but we also override it when the situation warrants.
The model shift comes just as the midterm election cycle peaks. Historical patterns suggest that the March decline may have pulled some of the typical second and third quarter weakness forward. But choppiness remains likely ahead of the midterms. We are not reducing our equity allocation based on politics. We are maintaining higher-than-normal cash based on valuation and risk. Our forty percent cash position is a statement, not an oversight. We want dry powder for the buying opportunity we believe is coming.
The Bottom Line on the Next Two Months
We are now at the historical two-month bottoming period for war-related oil shocks. The market has recovered. The question is whether the recovery holds. Our view is that the next two months will be defined by the conflict's trajectory and the consumer's resilience. If the war escalates, oil prices spike further, and the consumer finally breaks, the recent lows will be tested and likely broken. If a durable cease-fire emerges, energy prices retreat, and the consumer holds up, the recovery could extend into the summer.
We are not predicting either outcome. We are preparing for both. Our cash is high. Our shorts are in place. Our value positions are small and selective. Our Japanese semiconductor equipment positions are steady accumulations. Our Chinese watchlist is ready. We are not heroes. We are not gamblers. We are stewards of capital, and we are acting accordingly.
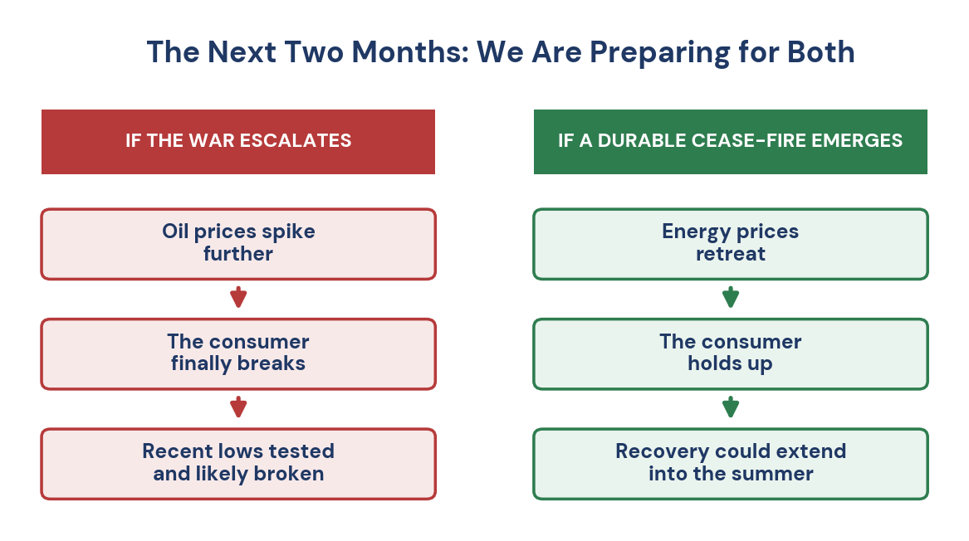 Figure 4. The next two months: escalation or a durable cease-fire.
The trends that began with the attack are continuing. But they are doing so on increasingly fragile footing. We are watching. We are waiting. And when the moment comes, we will act.
Sincerely,
Bull Bear Bust
DISCLAIMER This newsletter is published for informational and educational purposes only. Nothing contained herein constitutes investment advice, a solicitation, or a recommendation to buy or sell any financial instrument. All investment involves risk, including the loss of principal. Past commentary does not guarantee future results. Any views expressed are those of the author as of the date of publication and are subject to change without notice. Please consult a licensed financial advisor before making any investment decisions. |