United States · Macro · Equities · Research
USA Strategy Report – Mid October 2026
Why This Is a Fragile Top, Not a Yellow-Light Bull
Bull, Bear, Bust · 25 October 2026 · 11 min read

Dear Client,
This month's strategy report reassesses where the US market sits in the cycle. The S&P 500 remains within roughly 1–2% of its all-time high, yet credit, breadth and monetary policy have all deteriorated at the same time. In this report, we explain why we now classify the market as a Fragile Top rather than a Yellow-Light Bull, how we rate the six risk dimensions, and how we position for each phase of the next six months, from October 2026 to April 2027.
KEY POINTS A quick-read snapshot of this newsletter's commentary
▸ The market has moved from a "Yellow-Light Bull" to a Fragile Top: the S&P 500 is within roughly 1–2% of its all-time high, while credit, breadth and monetary policy have cracked at the same time. ▸ Breadth is at record extremes relative to the index: fewer than 25% of index constituents trade above their 50-day moving average, and 60% of S&P 500 companies are already in a structural bear market. ▸ Credit is the more important signal: HY OAS has widened 46 bps in roughly a month to 315 bps, and CCC and below OAS has surged to 12.29%, versus 8.12% a year ago. ▸ Valuation is extreme: CAPE is 40.71, only the second time above 40 in history (the other was 1999), so the recovery space from any shock is enormous. ▸ Monetary policy offers no rescue: Fed funds sit at 3.75–4.00% after the September hike, the December hike probability is about 67–78%, and the 10-year Treasury yield is about 5.3%. ▸ Phase 1 (October – December 2026): retain core participation and raise cash / short-duration Treasuries to a tactical overweight of 5–10%. Phase 2 (January – March 2027): move to selective participation, add convexity hedges and migrate from HY toward IG. ▸ Positioning bias: overweight IG credit and quality, low-leverage equities; underweight or avoid HY, private credit and CMBS; hold tail hedges rather than panic-buy them. ▸ Combined trigger rule: HY OAS above 350 bps together with an S&P 500 weekly close below the 200-day MA confirms the transition from "Fragile Top" to "Credit-Confirmed Downturn". |
Bottom line: the market is no longer in a simple "cautious bull" phase. It has entered a Fragile Top regime — the index sits near highs, but the foundation beneath it has cracked in credit, breadth, and monetary policy simultaneously. The next six months are not about guessing the exact crash date; they are about positioning for a convergence where credit and breadth eventually drag the index down to their level.
1. Situational Diagnosis: Why This Is a Fragile Top, Not a Yellow-Light Bull
The prior framework called this a "Yellow-Light Bull" — trend and breadth positive, sentiment defensive. That description no longer holds. The internal deterioration is now too severe to classify breadth as "positive."
The defining contradiction: The S&P (Standard & Poor's) 500 is within roughly 1–2% of its all-time high. Yet:
- Fewer than 25% of index constituents were trading above their 50-day moving average; below 45% above their 200-day.
- NDR (Ned Davis Research) itself flagged that the simultaneous occurrence of (1) fewer than 35% above the 50-day, (2) fewer than 50% above the 200-day, and (3) the S&P 500 within 3% of its high has happened only six times since 1980 — and historically these signals appeared ahead of market peaks.
- 60% of S&P 500 companies are already in a structural bear market, more than 20% below their all-time highs. That bucket is only 31% of the index by weight. Just 66 stocks sit within 10% of their high — they are 13% of members but 43% of the index weight.
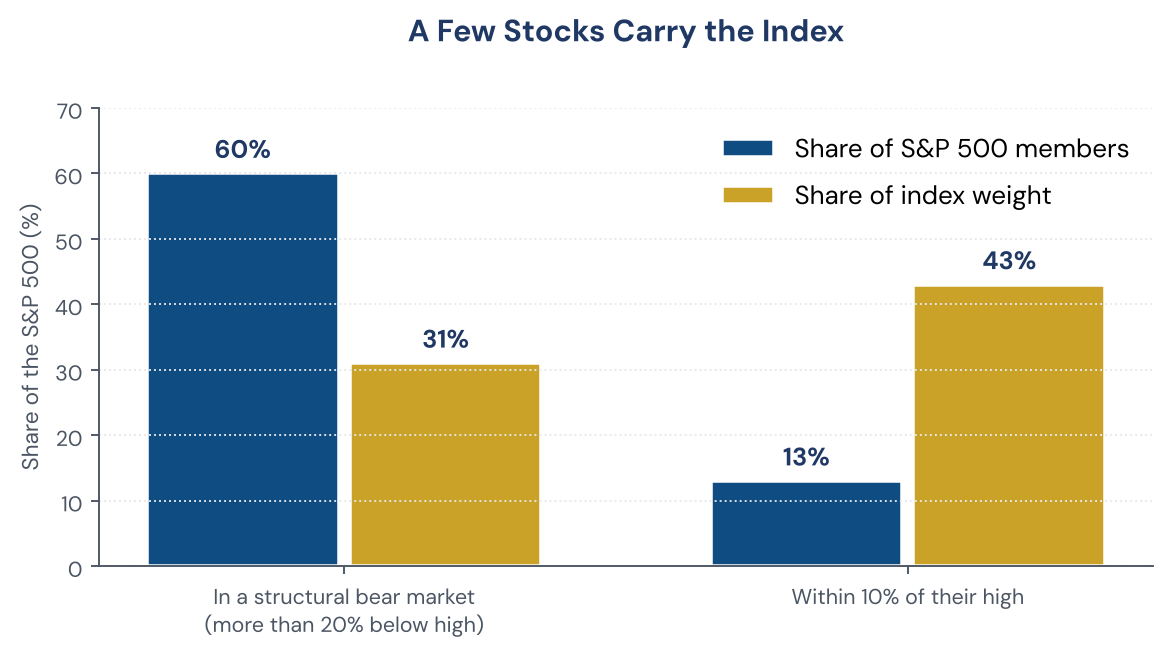
Figure 1. Stocks in a bear market are 60% of S&P 500 members but 31% of its weight, while stocks near their highs are 13% of members but 43% of weight.
Credit is the more important signal. The equity index can be masked by mega-cap concentration; credit spreads cannot. As of early October 2026:
- HY (high-yield, i.e., below-investment-grade) OAS (option-adjusted spread) sits at 315 basis points (bps; 1 bp = 0.01 percentage point), up from 261 bps at the end of August — a 46 bp widening in roughly a month, the sharpest move since the United States (US)–Iran military operations in late February.
- CCC and below OAS has surged to 12.29%, versus 8.12% a year ago — a 51% widening year-over-year (YoY). CCC is not an acronym: it is a speculative-grade credit rating tier, below B and above CC, representing substantial default risk and high sensitivity to refinancing conditions. "CCC and below" includes CCC+, CCC, CCC–, CC, C, and defaulted/D-rated issuers.
- CCC spreads have widened by 324 bps since the end of April, while BB and B spreads (higher speculative-grade rating tiers) widened only 23 bps and 5 bps, respectively. The stress is concentrated at the bottom, but it is moving fast.
- CMBS (commercial mortgage-backed securities) delinquency has reached 8.02%, roughly six times the pandemic-era low; office mortgage delinquency exceeds 12%.
- Private credit's trailing default rate is a record 6.1%, more than double public high yield, with roughly 60% driven by interest deferral rather than missed payments — a sign that the stress is being masked, not resolved.
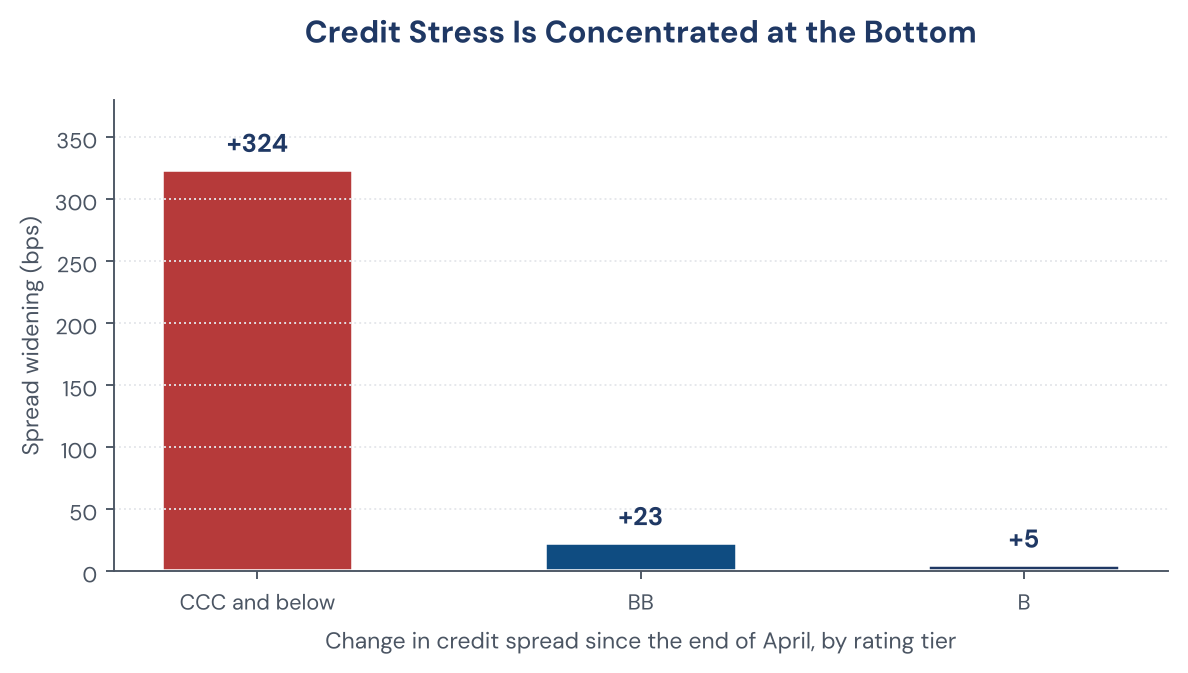
Figure 2. CCC-rated spreads have widened far more than BB or B since the end of April.
The credit-equity divergence is the core thesis: credit is repricing risk at a pace the equity index has not acknowledged. HY OAS historically leads equity drawdowns by 2–4 weeks in stress regimes, because credit dealers reprice before equity volatility-targeting strategies adjust. When the two diverge, the historical resolution is prices moving down to breadth/credit, not the other way around.
2. Six-Dimension Risk Matrix (as of mid-October 2026)
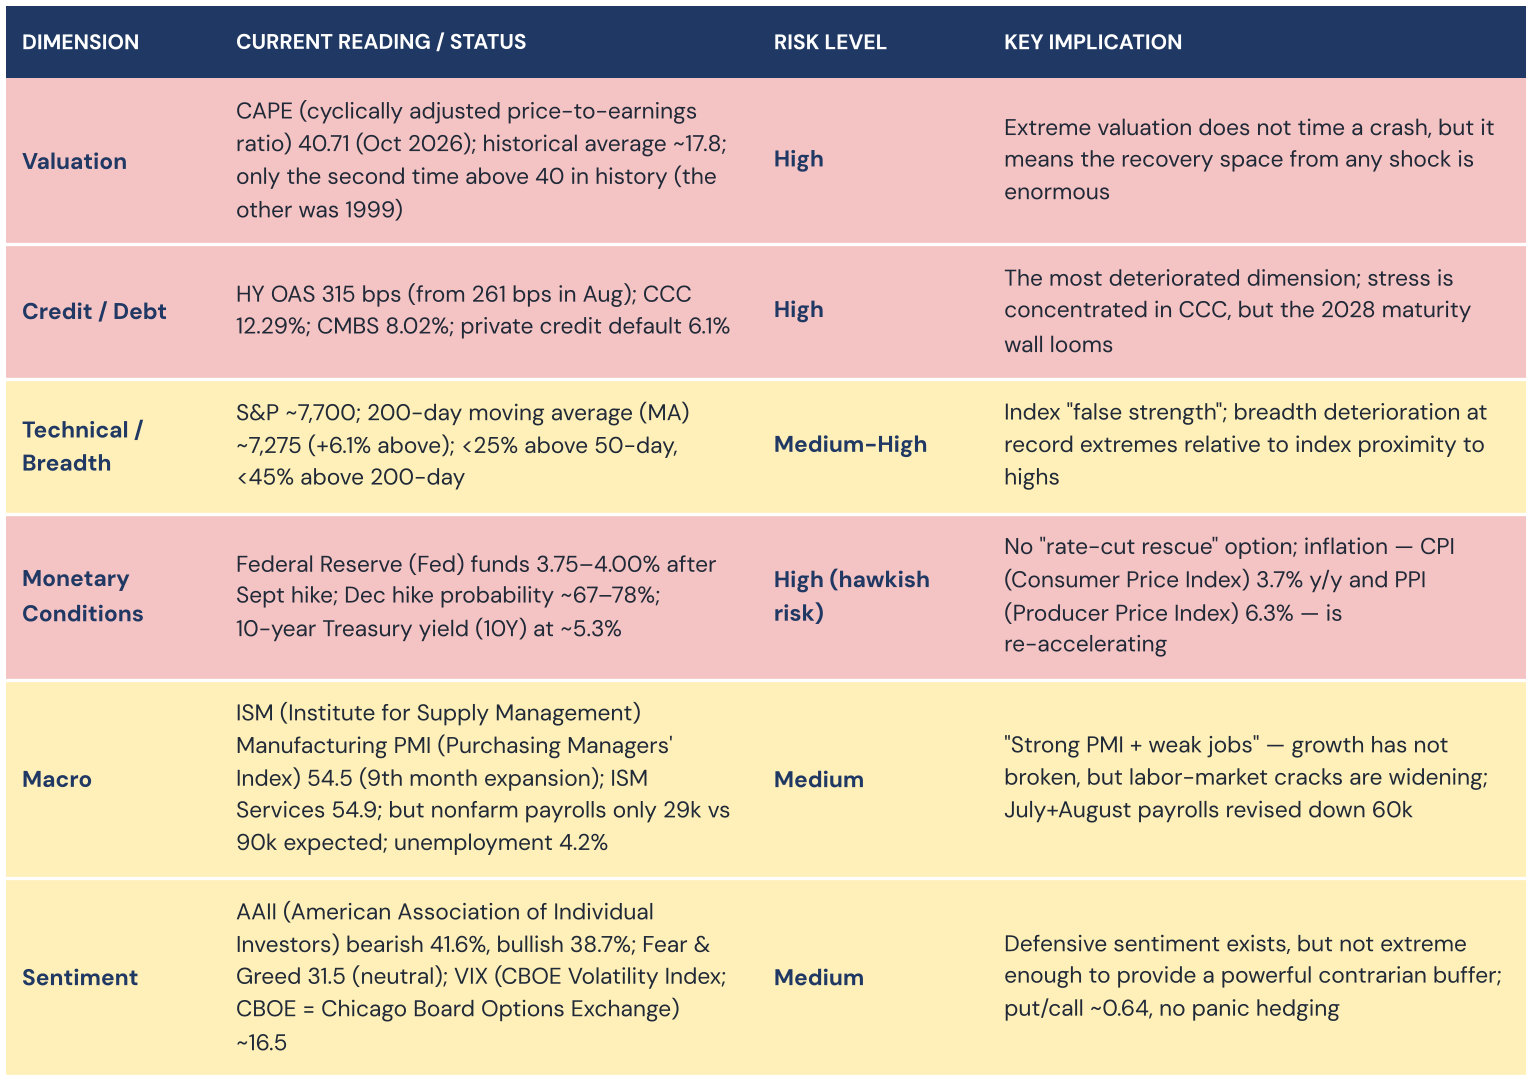
Figure 3. The six-dimension US market risk matrix, shaded by risk level for October 2026.
Composite assessment: Two red-rated dimensions (valuation, credit) plus one red-rated dimension (monetary hawkish risk) push the overall regime from "Moderate (Yellow)" to Elevated (Orange-Light). The combination of higher-for-longer rates + widening credit spreads + a 2028 maturity wall is the self-reinforcing loop that matters most.
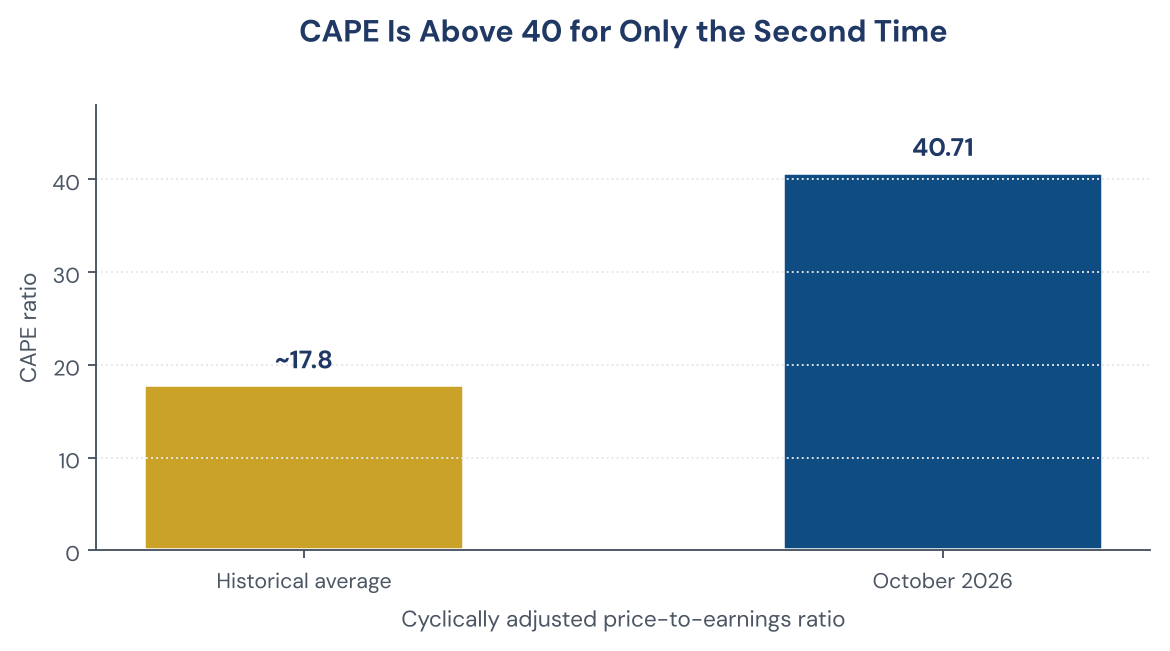
Figure 4. The CAPE ratio is 40.71, against a historical average of about 17.8.
3. Six-Month Strategy Roadmap (October 2026 – April 2027)
Phase 1: October – December 2026 — "The Fragile Balance"
Base case (probability ~55–60%): The index oscillates near highs or grinds slightly lower. AI (artificial intelligence) concentration temporarily sustains the headline index, but the internal correction continues to spread. A 5–8% index-level drawdown is more likely than not (~40–50% probability), but it is not yet systemic, because HY OAS at 315 bps is still below the 350–400 bps "systemic stress" threshold.
Strategic implications:
-
Do not chase the index, but retain core participation. The index may continue to look better than the average stock because of AI weight. Expressing long exposure through the index has a deteriorating risk/reward; express it through quality, low-leverage, cash-flow-visible companies instead.
-
Raise cash / short-duration Treasuries to a tactical overweight (5–10%). With a December hike priced at ~67–78%, there is no near-term "Fed put" in the options market. Cash is not just defense — it is the optionality to redeploy when credit stress becomes explicit.
-
Differentiate within AI concentration. The credit market is already separating the megacaps with genuine free cash flow from those reliant on debt-financed AI capex. Oracle's CDS (credit default swap) reached record highs earlier in the cycle; technology sector credit spreads have moved from ~10 bps tighter than the broader IG (investment-grade) index a year ago to ~15 bps wider now — a relative swing of ~25 bps. This is not a sudden deterioration in megacap fundamentals; it is bond investors demanding a higher premium for the scale of AI-related debt issuance. Key triggers to move to Phase 2 (defensive shift):
-
HY OAS breaks 350 bps, or CCC spreads widen further while BB/B spreads begin to follow;
-
S&P 500 weekly close below the 200-day MA (~7,275);
-
December FOMC (Federal Open Market Committee) delivers a hike and the dot plot shifts higher, or the Fed chair fails to rule out further tightening in 2027.
Phase 2: January – March 2027 — "The Stress-Test Window"
Base case (probability ~45–50%): This is the most likely window for credit refinancing anxiety and macro cracks to intersect. The 2028 high-yield maturity wall begins to be priced in advance: 88% of high-yield bonds mature within seven years, and the share of CCC-and-below maturities rises from an 11.6% monthly average in 2027 to 16.6% in 2028. At the same time, if the labor market deteriorates further — nonfarm payrolls below 50k for two consecutive months, unemployment above 4.5% — the market will be forced to reprice the existence and timing of any future Fed easing.
Strategic implications:
- Reduce equity exposure from "core participation" to "selective participation." Retain exposure to high-quality, low-leverage, cash-generative businesses; materially cut exposure to high-multiple growth and debt-dependent business models.
- Add convexity hedges rather than outright shorts. OTM (out-of-the-money) put spreads or VIX call spreads are relatively inexpensive while VIX is in the mid-teens and credit has not yet broken 350 bps. Waiting for volatility to spike before hedging defeats the purpose.
- Within fixed income, migrate from HY toward IG and short-duration Treasuries. IG spreads widened only 4 bps over the same period HY widened 46 bps. The stress has not yet systematically penetrated IG. But CCC is the leading edge; if CCC stress begins to pull BB/B spreads wider, the migration should accelerate. The single most important metric to watch in this phase: whether HY OAS sustains above 350–400 bps for more than four weeks. Historically, a sustained hold above that band is associated with the transition from "correction" to "bear market."
Phase 3: April 2027 and Beyond — "Path Divergence"
Two paths depend on whether Phase 2 triggers a credit-breadth negative feedback loop:
Path A — Credit stabilizes (probability ~35–40%): HY OAS peaks near 350 bps and retreats; CCC spreads stop widening; payrolls stabilize above 100k. The market completes a 10–12% drawdown and then resumes higher as earnings breadth improves. In this path, the Phase 1–2 defensive positioning was an insurance premium, not a permanent bearish call — exposure should be rebuilt toward neutral once credit conditions confirm improvement.
Path B — Credit stress spreads (probability ~25–30%): CCC stress penetrates BB/B; HY OAS breaks 400 bps and moves toward 500 bps; the S&P 500 decisively breaks the 200-day MA and breadth fails to repair. With CAPE at 41, the downside is historically asymmetric. The prior two times CAPE approached this level (1929, 1999), the subsequent drawdowns were not mild: the Dow fell ~89% from 1929–1932; the S&P 500 fell ~49% from March 2000 to October 2002, and the Nasdaq fell ~77%. This does not mean the same outcome is inevitable — but it means the cost of being late to reduce risk in this path is very high.
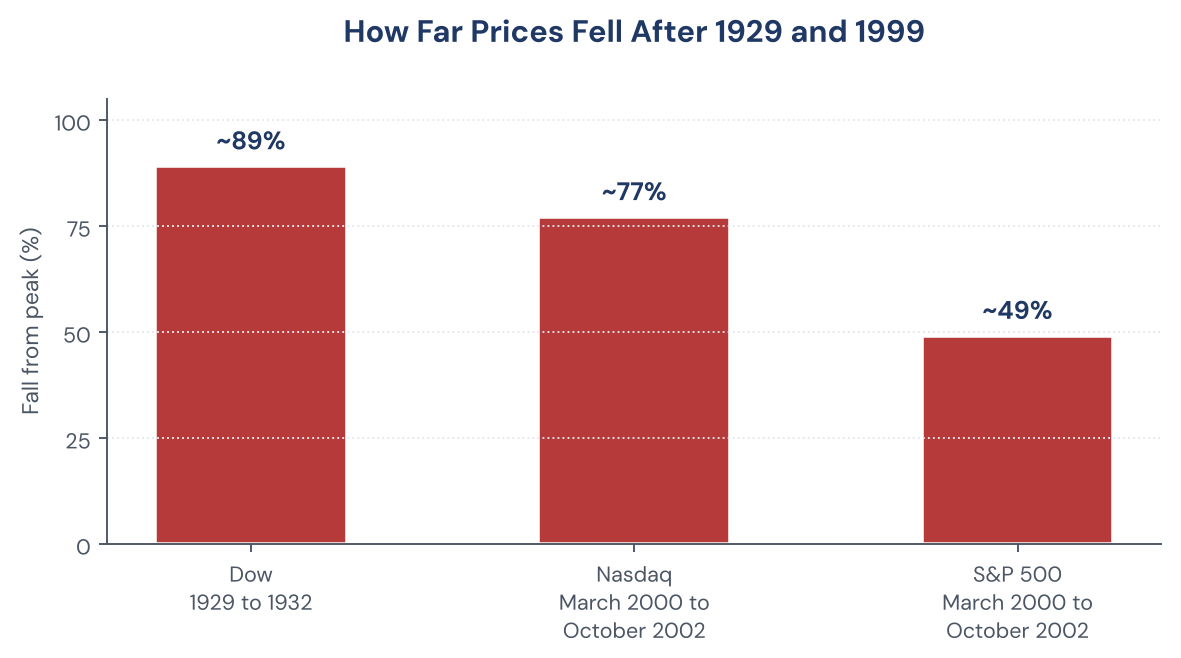
Figure 5. How far prices fell after the 1929 and 1999 peaks.
4. Cross-Asset Positioning Framework (Six-Month Bias)
| Asset Class | Bias | Rationale |
|---|---|---|
| US equities (broad index) | Neutral-to-underweight | Index fragile at highs; internal breadth at record extremes; risk/reward unfavorable |
| US equities (quality / low leverage) | Selective overweight | In a tightening credit environment, balance-sheet quality is the ultimate differentiator |
| AI concentration | Differentiate, do not treat as one exposure | Cash-flow-backed megacaps vs. debt-financed capex stories; credit is already separating them |
| IG credit | Overweight | IG widened only 4 bps vs HY 46 bps; stress has not systematically penetrated |
| HY / private credit / CMBS | Underweight / avoid | Cracks are spreading from CCC into the broader complex; 2028 maturity wall is a structural overhang |
| Cash / short-duration Treasuries | Tactical overweight (5–10%) | Optionality to redeploy when credit stress becomes explicit; December hike pricing limits the "easing rescue" scenario |
| Gold / real assets | Moderate allocation | Non-correlated hedge against "higher rates + credit stress + energy/geopolitical supply shocks" (oil ~109) |
| Tail hedges (put spreads / VIX convexity) | Hold, do not panic-buy | Cost is controllable while credit thresholds have not broken; buying after the break is too late |
5. Weekly Monitoring Dashboard (Trigger Thresholds)
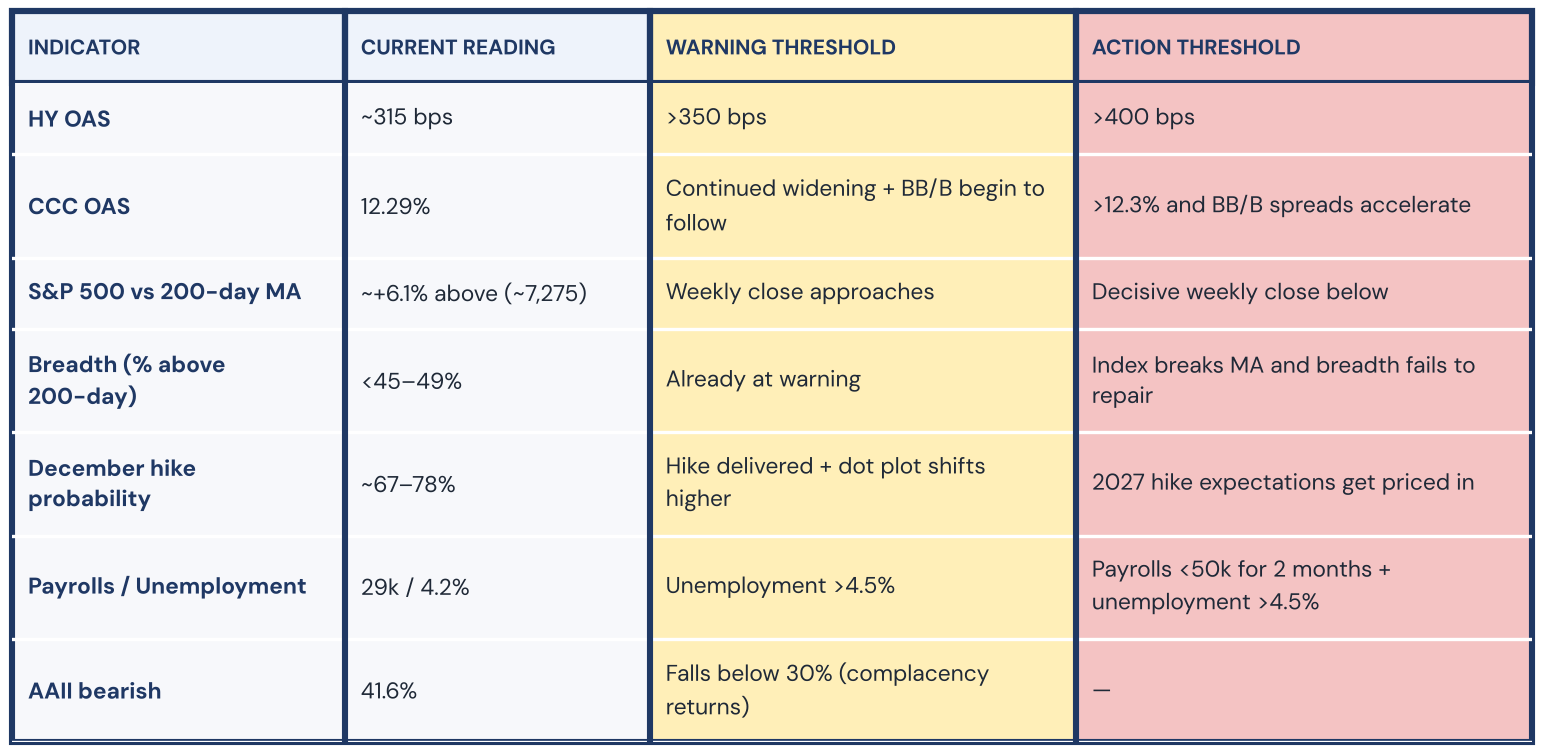
Figure 6. The weekly monitoring dashboard with warning and action thresholds.
Combined trigger rule: If HY OAS >350 bps and the S&P 500 weekly close below the 200-day MA occur together, treat it as confirmation of the transition from "Fragile Top" to "Credit-Confirmed Downturn" — the signal for a substantive reduction in equity exposure and a defensive rotation.
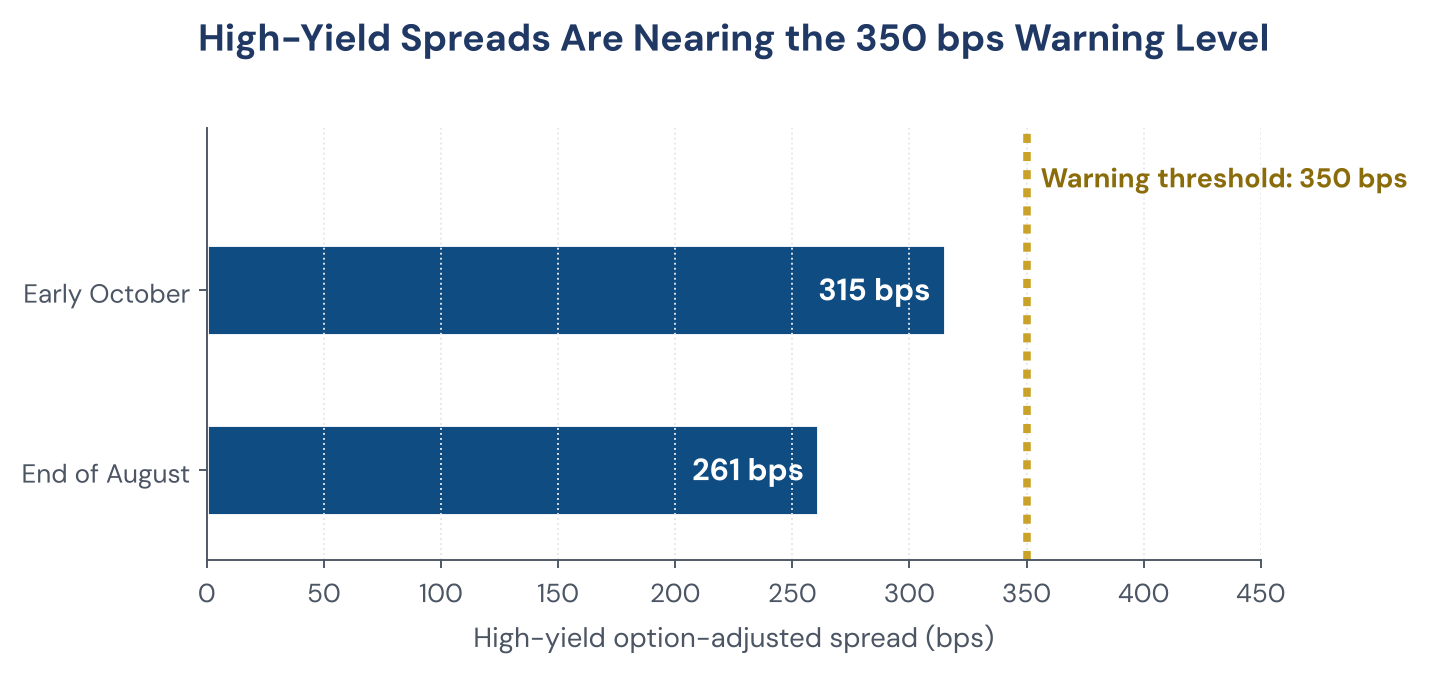
Figure 7. High-yield spreads are approaching the 350 bps warning level.
Final warning: The most dangerous feature of this market is not that valuations are high — high valuations can be digested by earnings growth. It is that the credit market is repricing risk at a speed the equity index has not reflected. The index's resilience comes from a handful of companies; credit spreads are the market's real-money judgment on the broad corporate sector's ability to service debt. When these two diverge persistently, history's answer is usually that the index converges toward credit, not the other way around. The task for the next six months is to prepare for that convergence, not to guess its exact date.
Sincerely,
Bull Bear Bust
DISCLAIMER This newsletter is published for informational and educational purposes only. Nothing contained herein constitutes investment advice, a solicitation, or a recommendation to buy or sell any financial instrument. All investment involves risk, including the loss of principal. Past commentary does not guarantee future results. Any views expressed are those of the author as of the date of publication and are subject to change without notice. Please consult a licensed financial advisor before making any investment decisions. |